Onboarding
Every new organization follows the same onboarding flow to ensure clean data, consistent financial statements, and reliable analytics. This setup is mandatory and takes only a few minutes.
TL;DR
Upload a trial balance or a journal-entry export, design your statements, map your accounts. Ready in under 10 minutes.
1. Upload Data
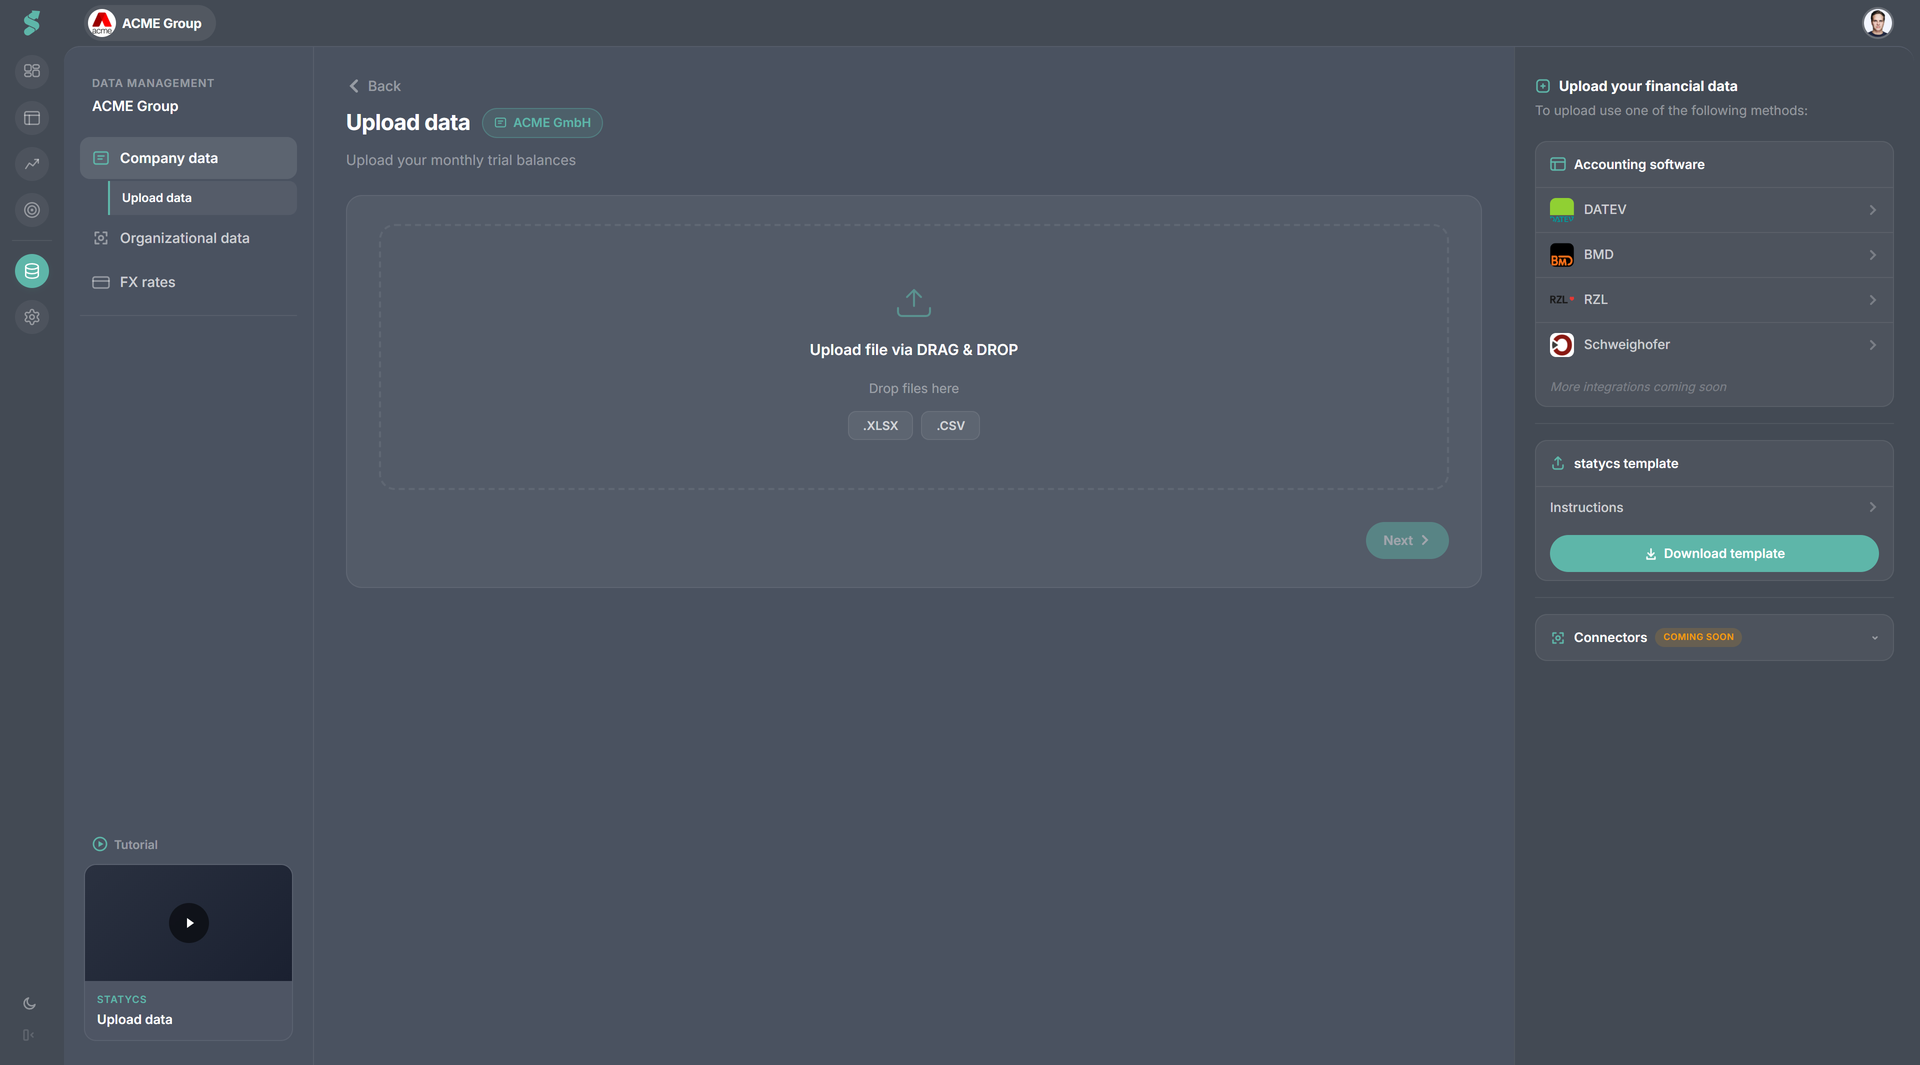
What you do
- Upload your figures as either a trial balance or journal entries
- Define company name, fiscal year-end, industry, and currency
Why it matters
- Standardized imports prevent format and structure issues
- Clear guidance ensures correct exports and templates
Trial balance or journal entries
Both routes end in the same place: mapped accounts and a working set of financials. They differ in how much detail sits underneath.
- Trial balance — one balance per account per period. The fastest way to get statements up.
- Journal entries — the individual postings. Your actuals are derived from them, and the entry-level features come with it: the Entries tab, drill-down from any figure to the postings that produced it, counterparties, and automatic checks.
You can change your mind later, but not blend the two. Uploading one source for a company replaces the other, and the actuals derived from it are deleted.
The journal entry template
Download the statycs journal entries template in the upload step, or map your own general-ledger export.
- One fiscal year per file, starting on the first day of that year. A year in progress is fine — upload it again as it grows.
- Include your opening balances — the carry-forward postings dated the first day of the year (DATEV: Saldenvorträge). Without them every balance sheet figure shows the year’s movement instead of the balance.
- Fill in Entry date · Account number · Account name · Description · Amount (net) · Counterparty name — one row per posting line.
- Use + (plus) for debit and − (minus) for credit, net of VAT. Same convention as the trial balance template.
- Optional columns unlock more: Counterparty ID and Document no. sharpen the duplicate checks, Entry type = OPENING keeps carry-forward rows out of your findings, Department maps to cost centers.
Using your own export
You do not have to reshape your ERP export. The first time statycs sees a layout it does not recognize, it asks you to match your columns once — pick the column for each field, and that mapping is reused for every later upload of the same export. Columns you do not map are kept on the entry and shown in the drawer; nothing is discarded.
Mappings are shared across every company in the organization, so a layout matched once serves them all. They are listed under Data Management.
Validation
- Unsupported formats trigger an error with clear instructions
- A journal export is checked before anything is written, and you are shown what it will replace
- You can only continue once a valid upload is detected
2. Design Financial Statements
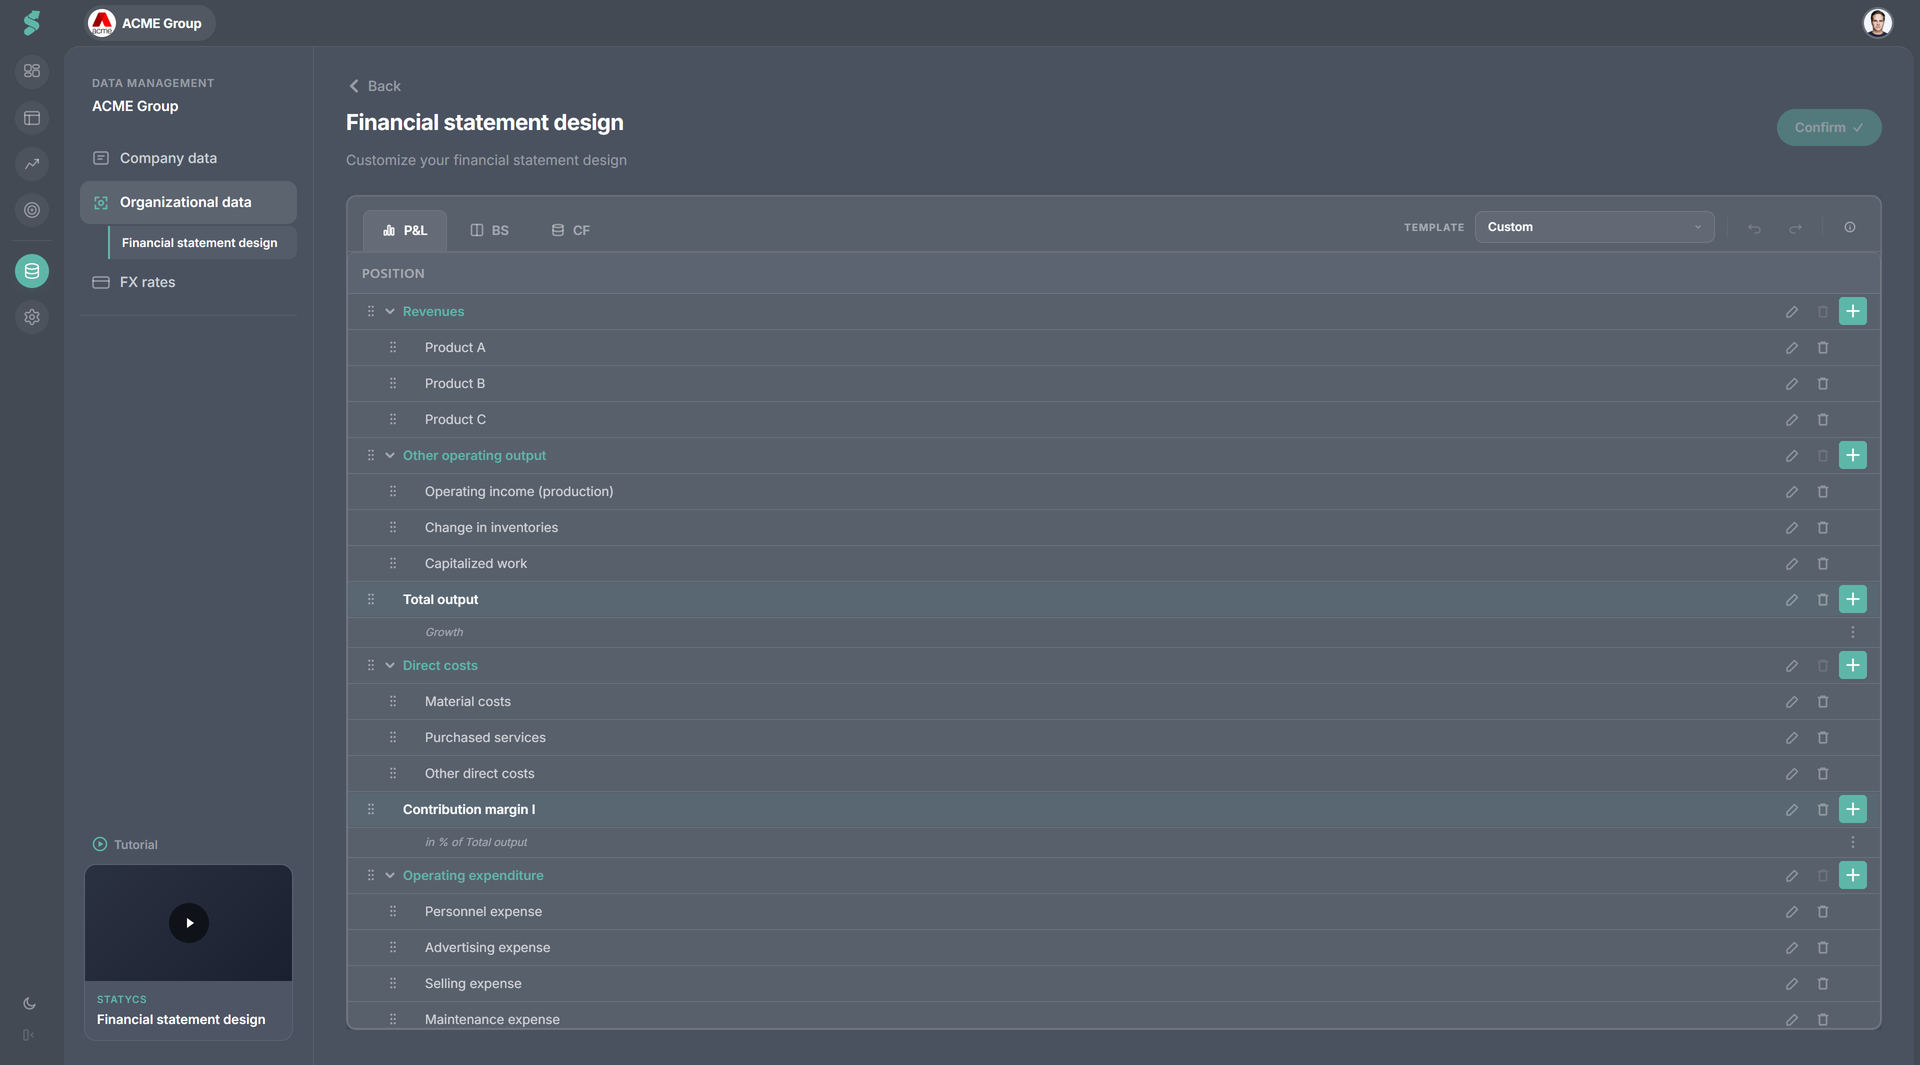
What you do
- Define the structure of your P&L, Balance Sheet, and Cash Flow
- Add and arrange Totals, Subtotals, Level 1, and Level 2 positions via drag & drop
- Start from templates or extend the predefined structure
Why it matters
- Reporting reflects your business logic - not your chart of accounts
- A consistent structure enables clean analysis and planning across all companies
You can refine Level 2 positions and account groups later. The goal at this stage is to establish a solid, consistent structure.
Hierarchy of Financial Data
statycs structures financial data in a clear, multi-level hierarchy. This ensures consistency, transparency, and reliable analytics across all reports and planning models.
- Totals
- Subtotals (BS & CF only)
- Level 1 Positions
- Level 2 Positions
- (Optional) Account Groups
- Accounts (Trial Balance)
- (Optional) Account Groups
- Level 2 Positions
- Level 1 Positions
- Subtotals (BS & CF only)
From top to bottom, the hierarchy works as follows:
Totals Examples: EBITDA, Total assets High-level aggregations that summarize multiple subtotals and positions.
Subtotals (Balance Sheet & Cash Flow only) Examples: Provisions, Current assets & accruals Intermediate aggregations used in Balance Sheet and Cash Flow statements to group related positions.
Level 1 Positions Examples: Revenues, Fixed assets Predefined reporting categories that form the backbone of your financial statements.
Level 2 Positions Examples: Personnel expense, PPE Customizable positions where you structure your business-specific reporting.
(Optional) Account Groups Optional grouping layer between Level 2 positions and individual accounts. Used for better structuring, analysis, and planning drivers.
Accounts Imported directly from your trial balance. These are the lowest-level data points in the hierarchy.
Mapping Rule
Accounts are always mapped to Level 2 positions. Mapping to Totals, Subtotals, or Level 1 positions is not possible.
This ensures a consistent structure and enables reliable analysis and planning.
Predefined Level 1 positions
Level 1 positions are predefined to ensure standardized financial logic and reliable analytics. These positions cannot be removed.
P&L
- Revenues
- Other operating output
- Direct costs
- Operating expenditure
- Other operating income
- Depreciation & amortization
- Net interest
- Other income / loss
- Non-recurring items
- Tax expense
Balance Sheet
- Fixed assets
- Inventory
- Trade receivables
- Other assets
- Cash & equivalents
- Equity
- Provisions
- Financial liabilities
- Trade payables
- Advance payments received
- Other liabilities
Level 2 positions and account groups are fully customizable within this structure.
Automatic logic & fixed positions
Certain positions include built-in logic to ensure consistent financial calculations.
- Level 2 positions under Fixed assets automatically generate CapEx, depreciation, and cash flow entries
- Positions under EBITDA populate “Other cash flow” entries
Fixed (non-editable) positions
- EBITDA
- Net income
- Total assets
- Total liabilities & equity
- Cash & equivalents
- Retained earnings / P&L carryforward
- Non-categorized (placeholder for unmapped accounts)
3. Map Accounts
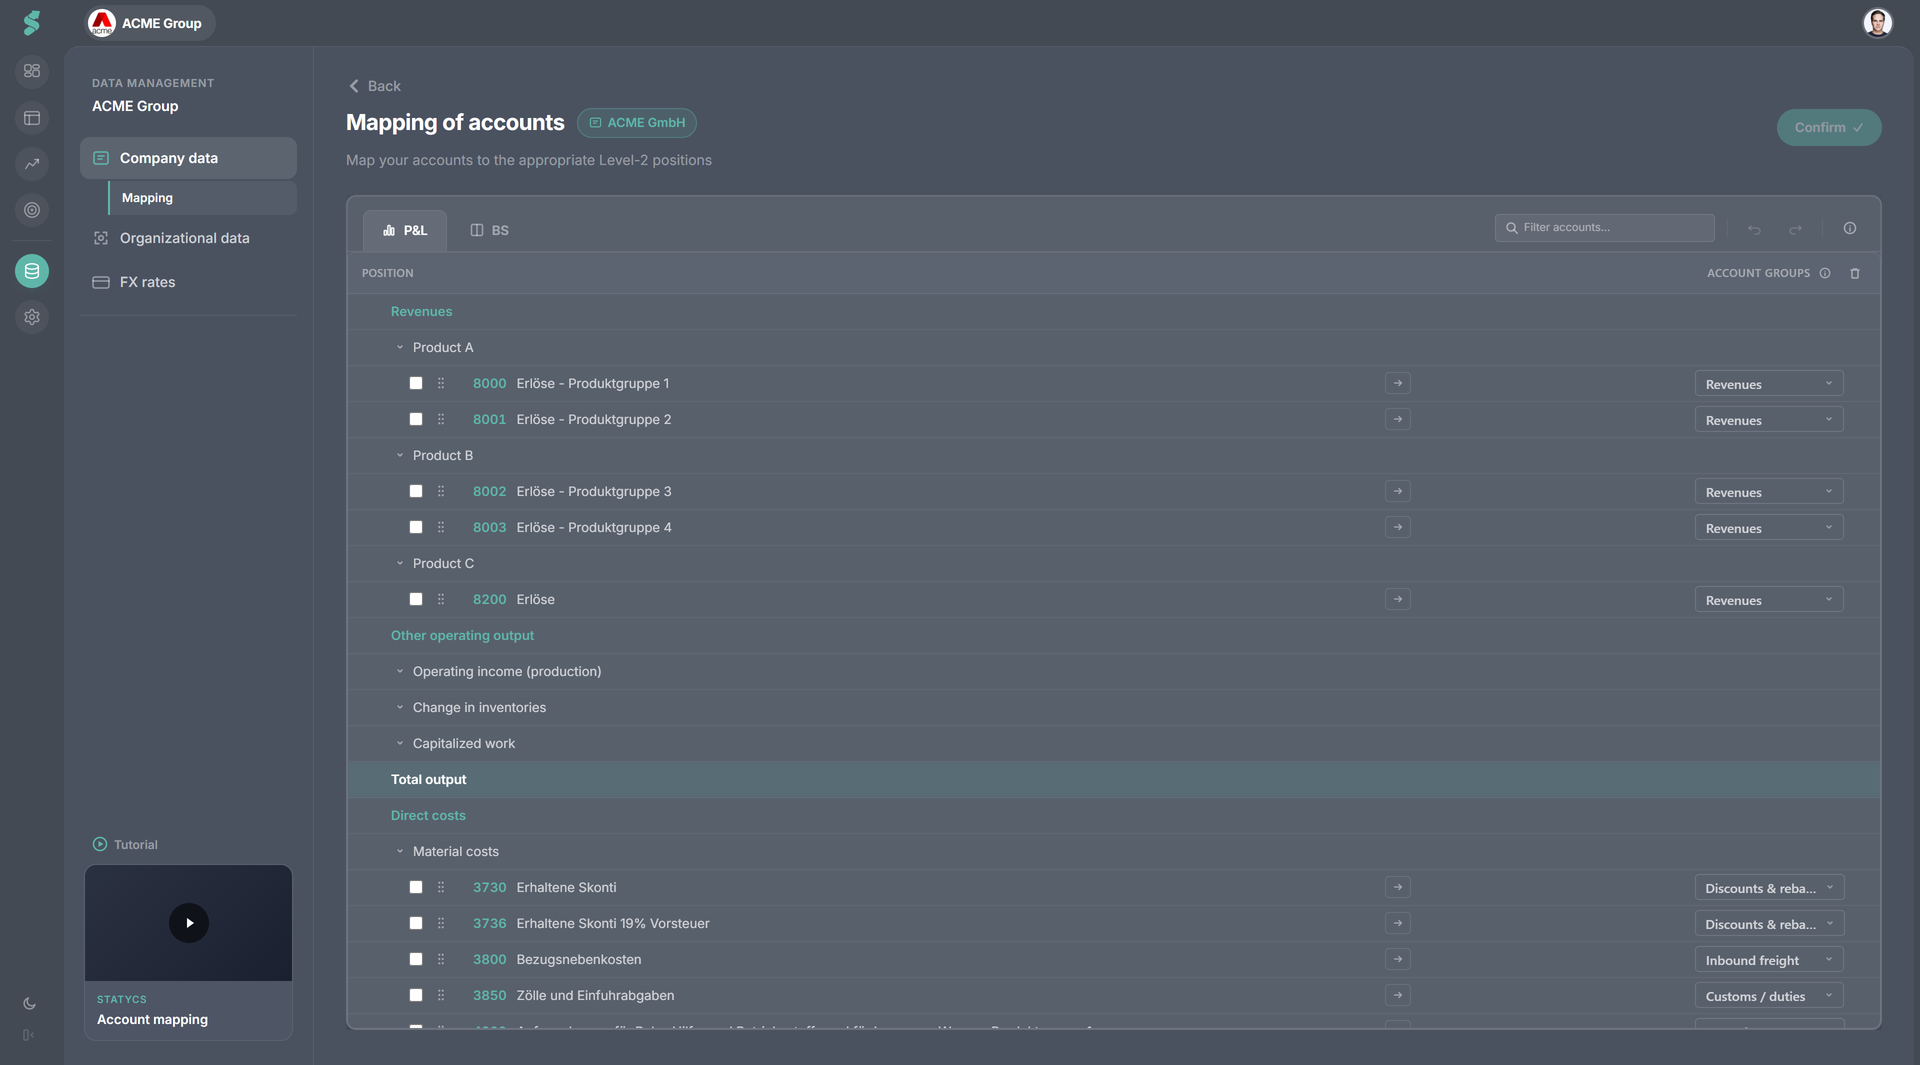
What you do
- Map trial balance accounts to Level 2 positions
- Create account groups as an intermediate structural layer between Level 2 positions and individual accounts
- Review and adjust auto-mapping (supported charts of accounts are recognized)
- Tag net debt and intercompany accounts
- Split debit and credit balances if required (e.g. negative receivables treated as liabilities)
Why it matters
- Automatic mapping reduces setup effort significantly
- Warning indicators immediately highlight unmapped accounts
- Correct structure and tagging prepare your data for analysis and planning
Account groups
Account groups are a structural layer between Level 2 positions and individual accounts. They improve grouping, enable cleaner analysis, and serve as drivers in planning.
Account groups are reused consistently across Financials, Analysis, and Planning.
Automapping & new uploads
- For supported accounting schemas, accounts are mapped automatically — the matcher runs server-side as part of the upload
- For previously mapped companies, new uploads that contain new or unknown accounts place those accounts automatically into Non-categorized
- This allows you to immediately identify and map new accounts correctly without affecting existing mappings
- Automapping coverage will be expanded continuously as more accounting schemas are supported
Per-department overrides (Departments add-on)
With the Departments add-on on, P&L accounts can carry per-department overrides: the same account routes to a different Level 2 depending on which department booked the GL line. Open the Departments popover next to any P&L account to add or edit overrides — for example, a shared overhead account that lands in Direct costs for Production but Operating expenditure everywhere else.