Report Builder
What the Report Builder is for
The Report Builder turns a company’s live statycs data into a finished presentation or document you can hand to a board, an investor, or an internal stakeholder. You pick a template, arrange charts, tables, KPIs, and text, and statycs fills in the figures — and, if you want, writes the commentary for you. Everything stays tied to live data, so re-opening a report always reflects the latest numbers.
TL;DR
Open it from the top-bar report icon (admin/editor to build; anyone can open, present, and export). Start from a template as either a 16:9 presentation deck or an A4 document, drop in blocks, and Export to PDF. Commentary is generated automatically from your numbers.
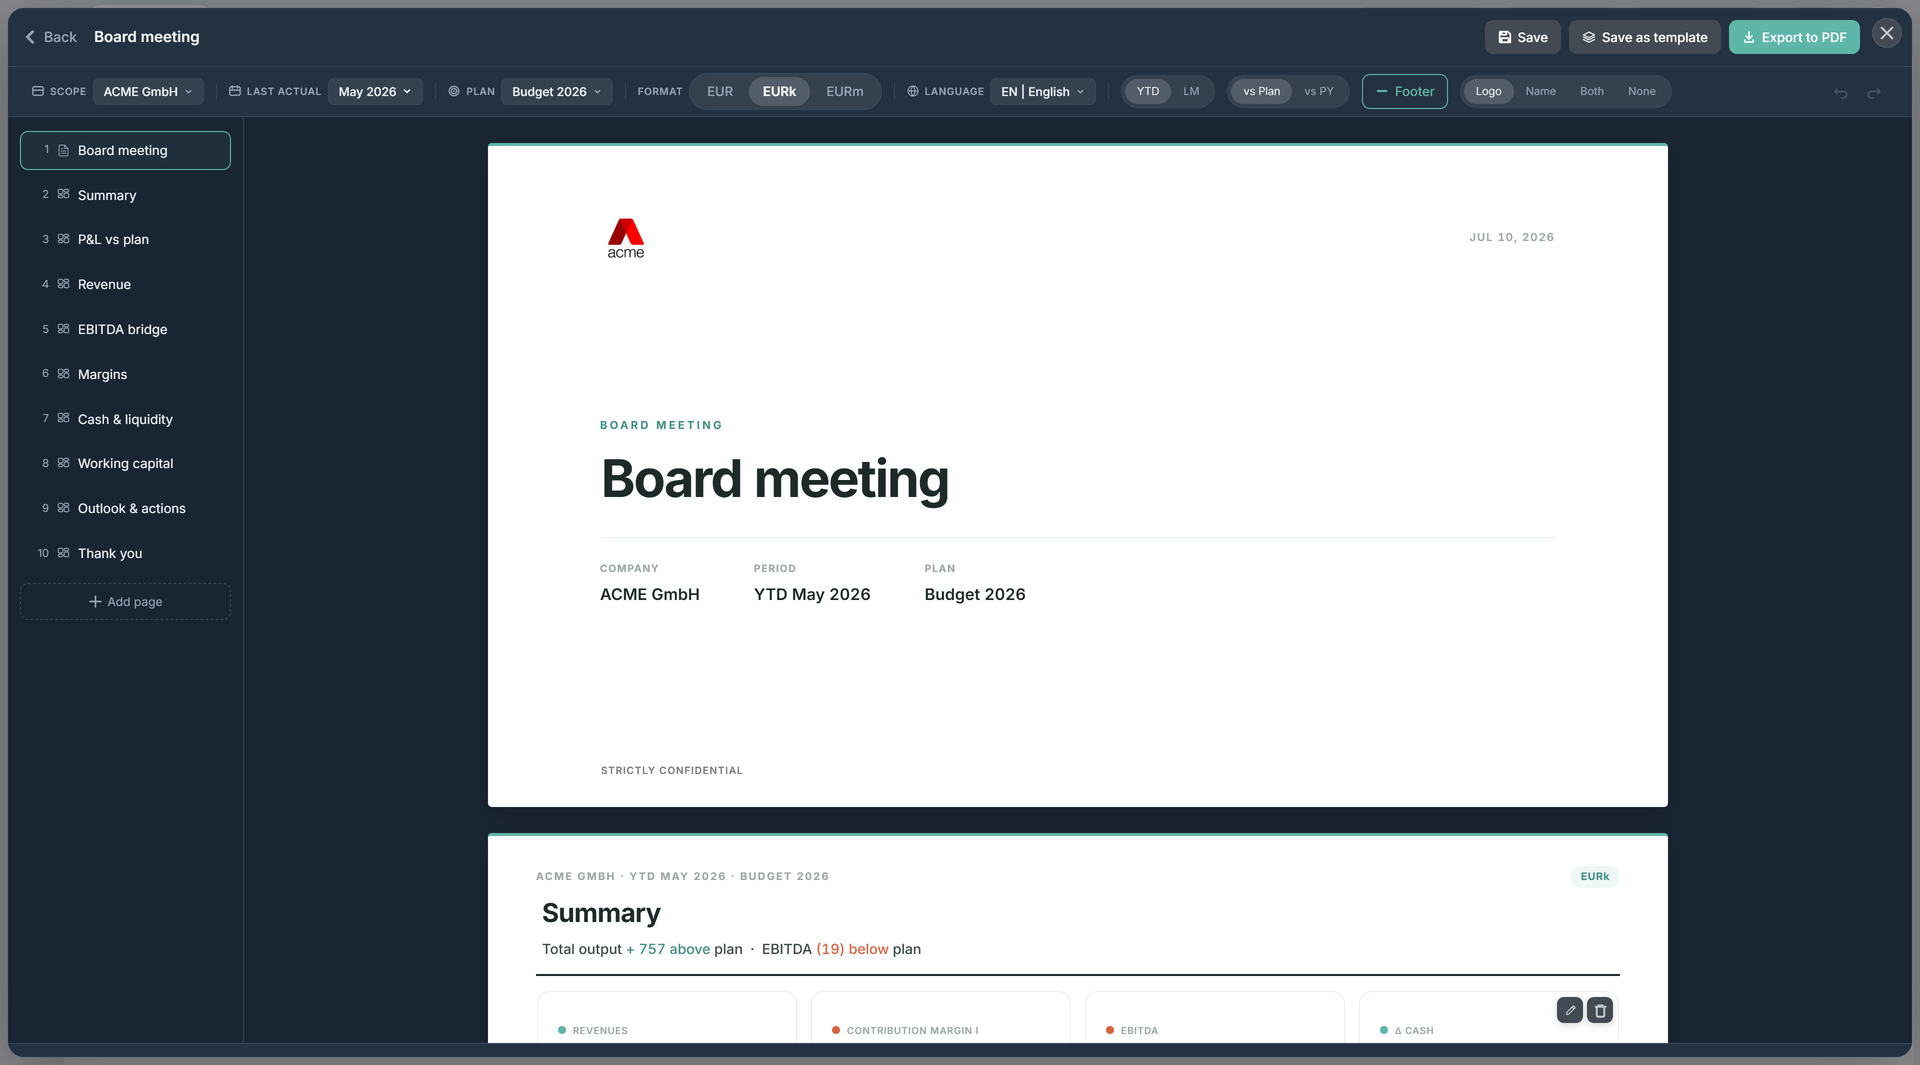
Opening the Report Builder
The builder lives behind the report icon in the top bar, just left of the company selector. It opens as a full-screen overlay — press Esc on the landing (or use the close button) to return to what you were doing.
- Everyone can open it to browse, present, and export saved reports.
- Editing (creating reports, adding blocks, saving, saving templates) is limited to Super Admin / Admin / Editor; viewers get a read-only landing.
- The icon is hidden on Data, Settings, and Planning — reports build from the Dashboard / Analysis / Financials surfaces, not the planner.
Two report types
You choose the type when you create a report; you don’t convert between them afterwards.
- Presentation — a 16:9 slide deck, built for screen and projector.
- Report — an A4-portrait document whose sections flow across real, discrete pages (screen matches print exactly, with running headers and page numbers).
The landing separates the two into a Presentations column and a Reports column, with an Automated band of live-data templates across the top.
The landing
- A dark Saved rail on the left lists your company’s saved reports (and a Draft entry if one is in progress), with delete controls.
- Automated templates come pre-built with live data and commentary.
- Presentations holds your custom templates plus Empty presentation; Reports holds Empty Report.
Templates
Six templates ship by default. Each stores what to show, not frozen figures, so the numbers are always current:
| Template | Type | What’s in it |
|---|---|---|
| Board Meeting | deck | A full CFO arc: summary, P&L vs plan, revenue, EBITDA bridge, margins, cash & liquidity, working capital, outlook. |
| Monthly Presentation | deck | A shorter monthly deck: summary, revenue, P&L, cash, working capital, outlook. |
| Monthly Report | document | An A4 report: summary, P&L, revenue, margins, EBITDA bridge, movers & watch items, balance sheet & cash, full-year forecast, actions — plus appendix P&L / BS / CF tables. |
| Quick Report | document | A short A4 update: performance, commentary, outlook. |
| Empty presentation | deck | A blank deck to build from scratch. |
| Empty Report | document | A blank A4 document. |
Use Save as template in the toolbar to save the current report as a custom template, shared across the company.
Building a report
Every report has a cover, one or more content pages, and a fixed closing page (a “Made with statycs” outro on decks; a closing page on documents) that can’t be deleted. Documents can also carry numbered sections and lettered appendices (each appendix starts its own page).
From the page strip on the left you can add, reorder (drag, or move up/down), duplicate, and delete pages (a report always keeps at least one).
Layout
Each content slide is a freeform 12-column grid — drag and resize any block to any position and size; overlapping blocks are pushed down. (In documents, blocks stack full-width in order.) Templates come with their blocks already placed, so you can start from a finished-looking page and adjust.
Blocks
Drop blocks onto a page from the + / Add block menu. Data blocks share the report’s current period and comparison (set in the context bar).
- Chart — any chart from the Analysis chart registry (including your custom charts), rendered live. A per-series picker lets you show/hide individual lines.
- Metric — a single headline number with its favourable/unfavourable delta.
- KPI — a small strip of KPIs with red/amber/green status dots.
- Table — a compact P&L, Balance Sheet, or Cash Flow table with a level toggle (Summary / Categories / Detailed) and hide empty rows.
- Text — a rich-text block in one of five styles: Heading, Subheading, Body, Callout, Bullets.
- Commentary — auto-written prose (see below).
Insight blocks
A set of ready-made analytical visuals you can drop in with no configuration — they read the report’s period and comparison directly:
- Working-capital tiles — DSO / DIO / DPO / CCC.
- P&L spine — Total output → Contribution margin I → EBITDA → EBIT → Net income.
- Top movers — the biggest P&L variances vs the comparison base.
- Watch items — alert cards for lines that need attention.
- Full-year forecast — year-to-date actuals plus remaining-at-plan against the full-year plan.
- BS position highlights — key balance-sheet lines annotated with working-capital days.
Auto-written commentary
The Commentary block (and the commentary built into the templates) is generated from your numbers — the same figures always produce the same text, in the report’s language. It is not AI: it’s a deterministic narrative engine covering the executive summary, the monthly P&L read, revenue, the EBITDA bridge, margins, cash, the balance sheet, working capital, and the outlook. It renders as bullets on decks and prose in documents, and slide subtitles auto-headline the key movement (teal for favourable, red for unfavourable).
Commentary updates live as you change period, comparison, or scope. Edit any commentary block to override it; a Reset to live text control puts the generated version back.
The context bar
A header row drives the whole report:
- Scope, Last actual month, and Plan — set the company, the actuals cut-off, and the plan to compare against (these use the same global context as the rest of the app).
- Format — number scale (units / thousands / millions).
- Language — the report’s frozen content language (see below).
- View (decks) — period YTD / LM, comparison vs Plan / vs PY, a Footer toggle, and a brand toggle (Logo / Name / Both / None).
- Undo / Redo and an “Updating…” indicator while figures re-derive.
Per-report language
A report’s content (commentary, chart labels, dates, units) is frozen to the language it was created in — switching the app’s language never re-translates a saved report. Change a report’s language from the globe control in the context bar. The builder’s own menus stay in your app language.
Export
Export with Export to PDF, which uses your browser’s print dialog: statycs sets the page size automatically — 16:9 for presentations, A4 portrait for documents — and strips the browser’s headers so you get a clean deck or paged report. (There’s no separate Excel export.)
Persistence and sharing
Reports and templates are saved to your statycs account (a dedicated reports service) — not your browser — shared across the company and editable by admins/editors. A report you’re building autosaves as a single shared draft until you Save it into the library. Only the spec is stored (which chart, which KPI, which text); the figures are derived live every time a report is opened, so nothing goes stale. If two editors change things at once, statycs reloads the latest and tells you.
Related
- Analysis — the charts and KPIs the builder pulls from
- Dashboard — the KPIs and metrics surfaced in report blocks
- Custom Dashboards — the interactive, in-app sibling of report decks