Financials
What Financials is for
The Financials workspace is the analytical home for your Profit & Loss, Balance Sheet, and Cash Flow. It blends actuals and plan into a continuous rolling view, lets you drill from subtotals all the way down to individual accounts, and gives every cell a place to attach context.
Financials is read-only as a view. Statement structure, account mappings, and source data are managed in Onboarding & Data.
TL;DR
Three statements (P&L, BS, CF), one rolling actuals + plan timeline, drill-down to accounts, with % of references and per-cell notes.
How Financials works
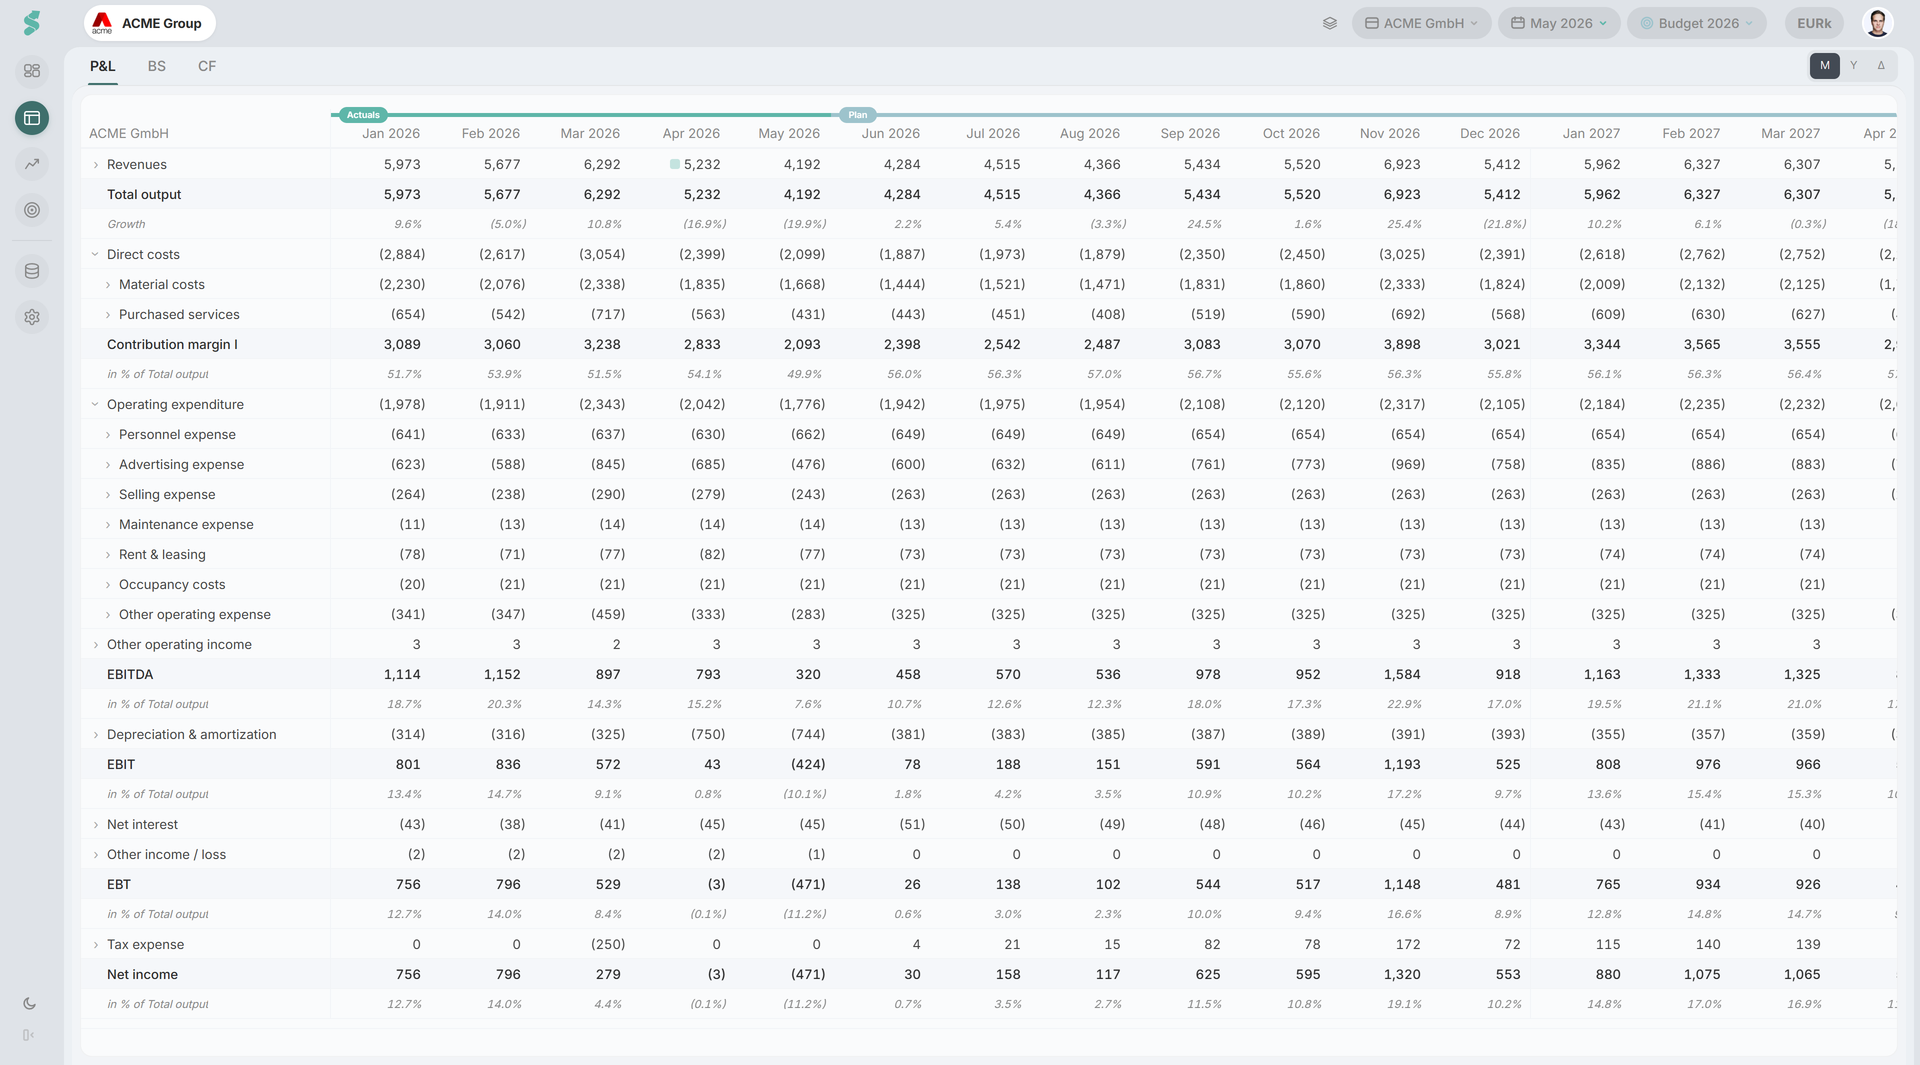
Financials always follows a rolling forecast: every period up to and including the selected last actuals shows actual data, every later period shows plan values from the selected plan. Without a plan, only actuals render.
When last actuals moves forward, statycs automatically rolls forward Retained earnings, P&L carryforward, and Cash & equivalents. Other positions stay at plan.
If last actuals and the plan are not compatible (for example, a gap month between them), a warning symbol appears on the plan selector.
Financials elements
Period toggle (M / Y / Δ)
The header toggle switches between three views:
- M — monthly view, one column per month
- Y — yearly view, one column per fiscal year
- Δ — variance view, two selectable ranges side by side with absolute and % delta columns
In Δ view, column 1 defaults to the matching plan period (or previous-year period when no plan is selected) and column 2 is freely chosen via the range selector — so the comparison is meaningful before you change anything.
Drill-down
Click the chevron on any row to step down the hierarchy:
Subtotal → Level 1 → Level 2 → Account groups → Individual accounts
% of row menu
Each row carries a % of reference used by the percentage column. Open the row menu to pick a top-level P&L position as the denominator: Revenues, Total output, Direct costs, Contribution margin I, Operating expenditure, Other operating income, EBITDA, or Free cash flow. Each entry is expandable — drill into a top-level position to pin the percentage to one of its child positions instead. The menu walks the hierarchy recursively, so you can pin a row’s percentage to any sensible denominator.
Department column view
When the Departments add-on is enabled, the P&L gains a Dept segment in the period toggle. Columns then represent departments instead of months, with a Company pin at the top and per-department drill. Dept view is P&L-only.
Comparison view
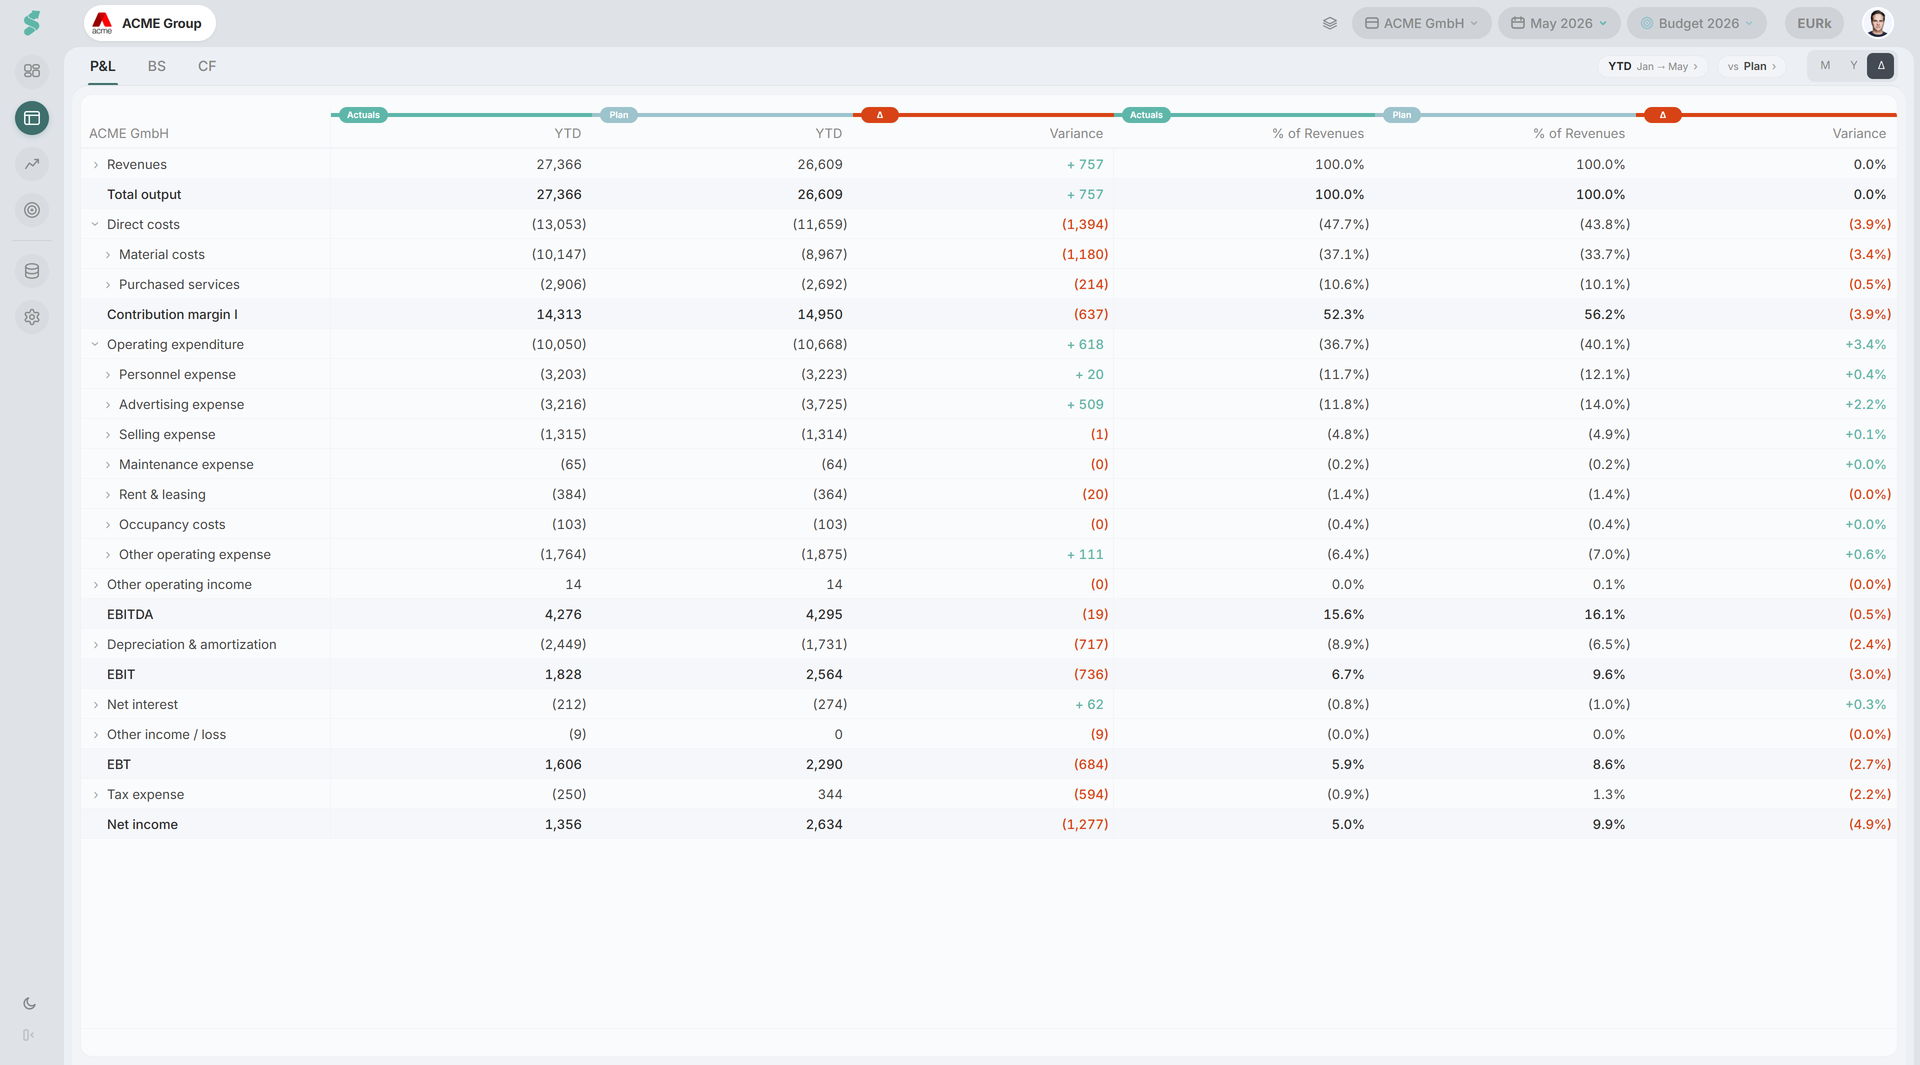
In Δ mode you can compare Actuals vs Plan or Actuals vs Actuals. Both columns and the delta format (absolute, %) are picked once and applied across the statement.
Notes
Any cell can carry a small annotation. Notes appear as an indicator on the cell and open a plain-text popup. Notes are anchored to a cell (row × period), shared across the company, and saved to your statycs account — see Notes.
Configure what you see
The kebab menu on the top-left cell exposes per-user display options: Expand all / Collapse all, Show growth / % of row, Show levels (Subtotals, L1, L2, account groups, accounts), Hide empty rows, and Display only actuals from […]. These options are saved to your statycs account per user, per company, and per statement (P&L / BS / CF independently), so they follow you across devices without changing what teammates see.
Related
- Notes — attach a comment to any cell
- Dashboard — curated KPI view sharing the same data
- Planning — drives the plan column behind the rolling forecast
- Departments add-on — D column view in P&L
- Onboarding & Data — structure, mappings, uploads