Accounts
What Accounts is for
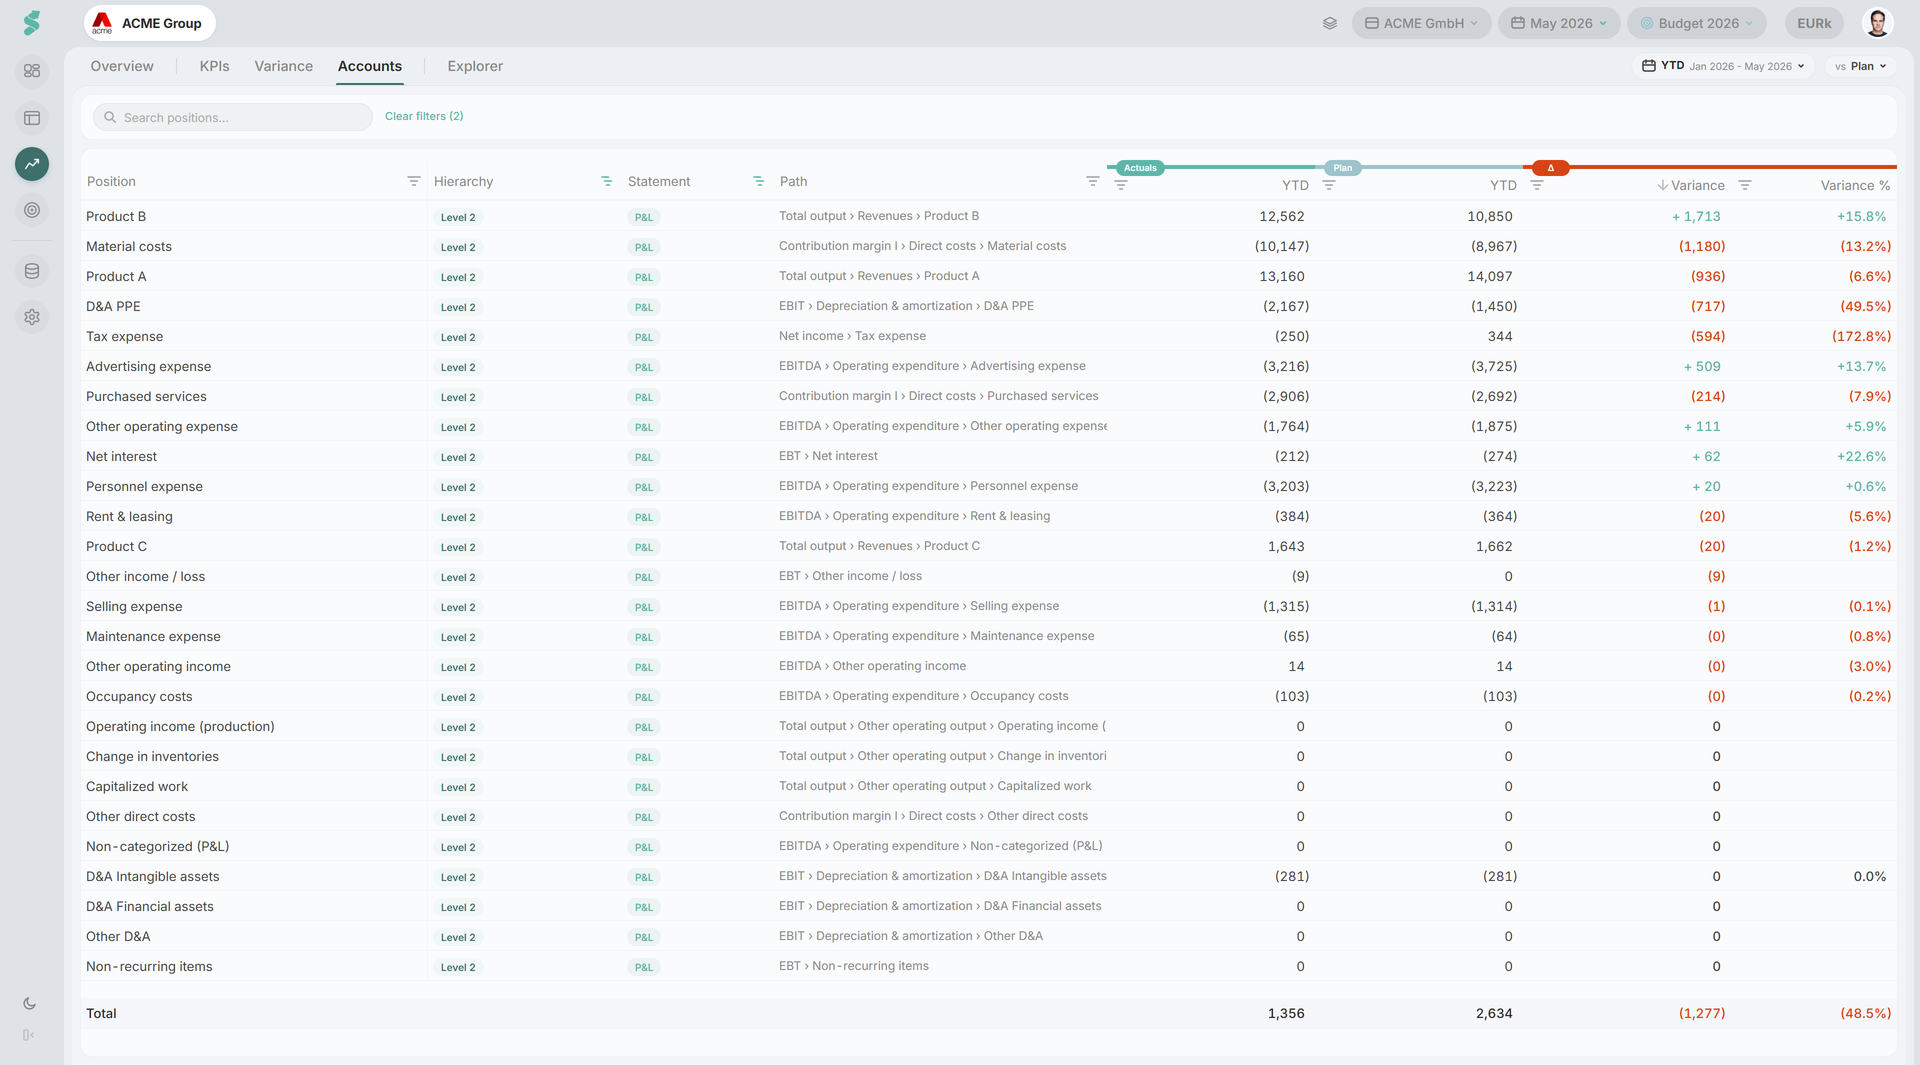
The Accounts tab is the raw, account-level view of statycs. While the rest of Analysis works on positions and KPIs, this tab exposes every row in the account hierarchy — Level 1, Level 2, account groups, and individual accounts across P&L, BS, and CF — in a single filterable grid.
Use it to answer “which account is causing this?” without leaving the Analysis workspace.
TL;DR
One flat grid of all positions across P&L, BS, and CF, with a quick-filter search, column filters in a right-hand sidebar, a pinned total row, and its own period preset.
How Accounts works
Accounts is one of the fixed tabs inside Analysis. It reads the same confirmed actuals and selected plan as the rest of statycs, but ignores the shared range preset and M/Y period toggle — both are hidden on this tab. The period semantics differ here: balances are computed against a dedicated period preset, with one row per position and a single value column per side.
Every row carries its statement (P&L / BS / CF), its hierarchy level, and its full path through the account plan. The pinned bottom row recomputes a Total every time the filter model changes.
Accounts tab elements
Subheader controls
- Period preset — calendar pill with YTD, LM, L3M, L6M, L12M. No CFY, no Prior Year, no custom range — Accounts is for current-state inspection.
- vs Plan / vs PY — compare pill that drives the second value column. Switching to PY repaints the column header pill from “Plan” to “PY”.
- The shared range preset and M/Y toggle are hidden on this tab.
Search bar
A quick-filter input above the grid, matched against position, hierarchy label, statement, and path. Clearing it (the close icon) restores all rows. Active column filters are summarised next to the search box with a one-click Clear N filters action.
Grid columns
- Position — pinned left, the row label.
- Hierarchy — pill: Level 1, Level 2, Account group, or Account.
- Statement — pill: P&L (teal), BS, or CF.
- Path — full breadcrumb through the account plan; truncates with a hover tooltip.
- Actuals — period actuals.
- Plan / PY — same period on the chosen comparison base.
- Variance and Variance (%) — Actual minus comparison; positive teal, negative red. Variance sorts ascending by default so the largest negative variances surface first.
Filters sidebar
A right-hand Filters tool panel is pinned open by default. Every column carries its native filter — text on Position and Path, set filters on Hierarchy and Statement, number filters on the value columns. The header pill recolours from “Plan” to “PY” when you switch the compare base.
Total row
A pinned bottom Total row sums Actuals and the comparison column after filtering, then recomputes Variance and Variance (%). Apply a filter and the total reflects only the visible rows.
Related
- Analysis — parent workspace and tab bar
- KPIs — derived metrics over the same data
- Variance — bridge view of position-level deltas
- Financials — same accounts in statement layout
- Data management — uploads and account plan source