Variance
What Variance is for
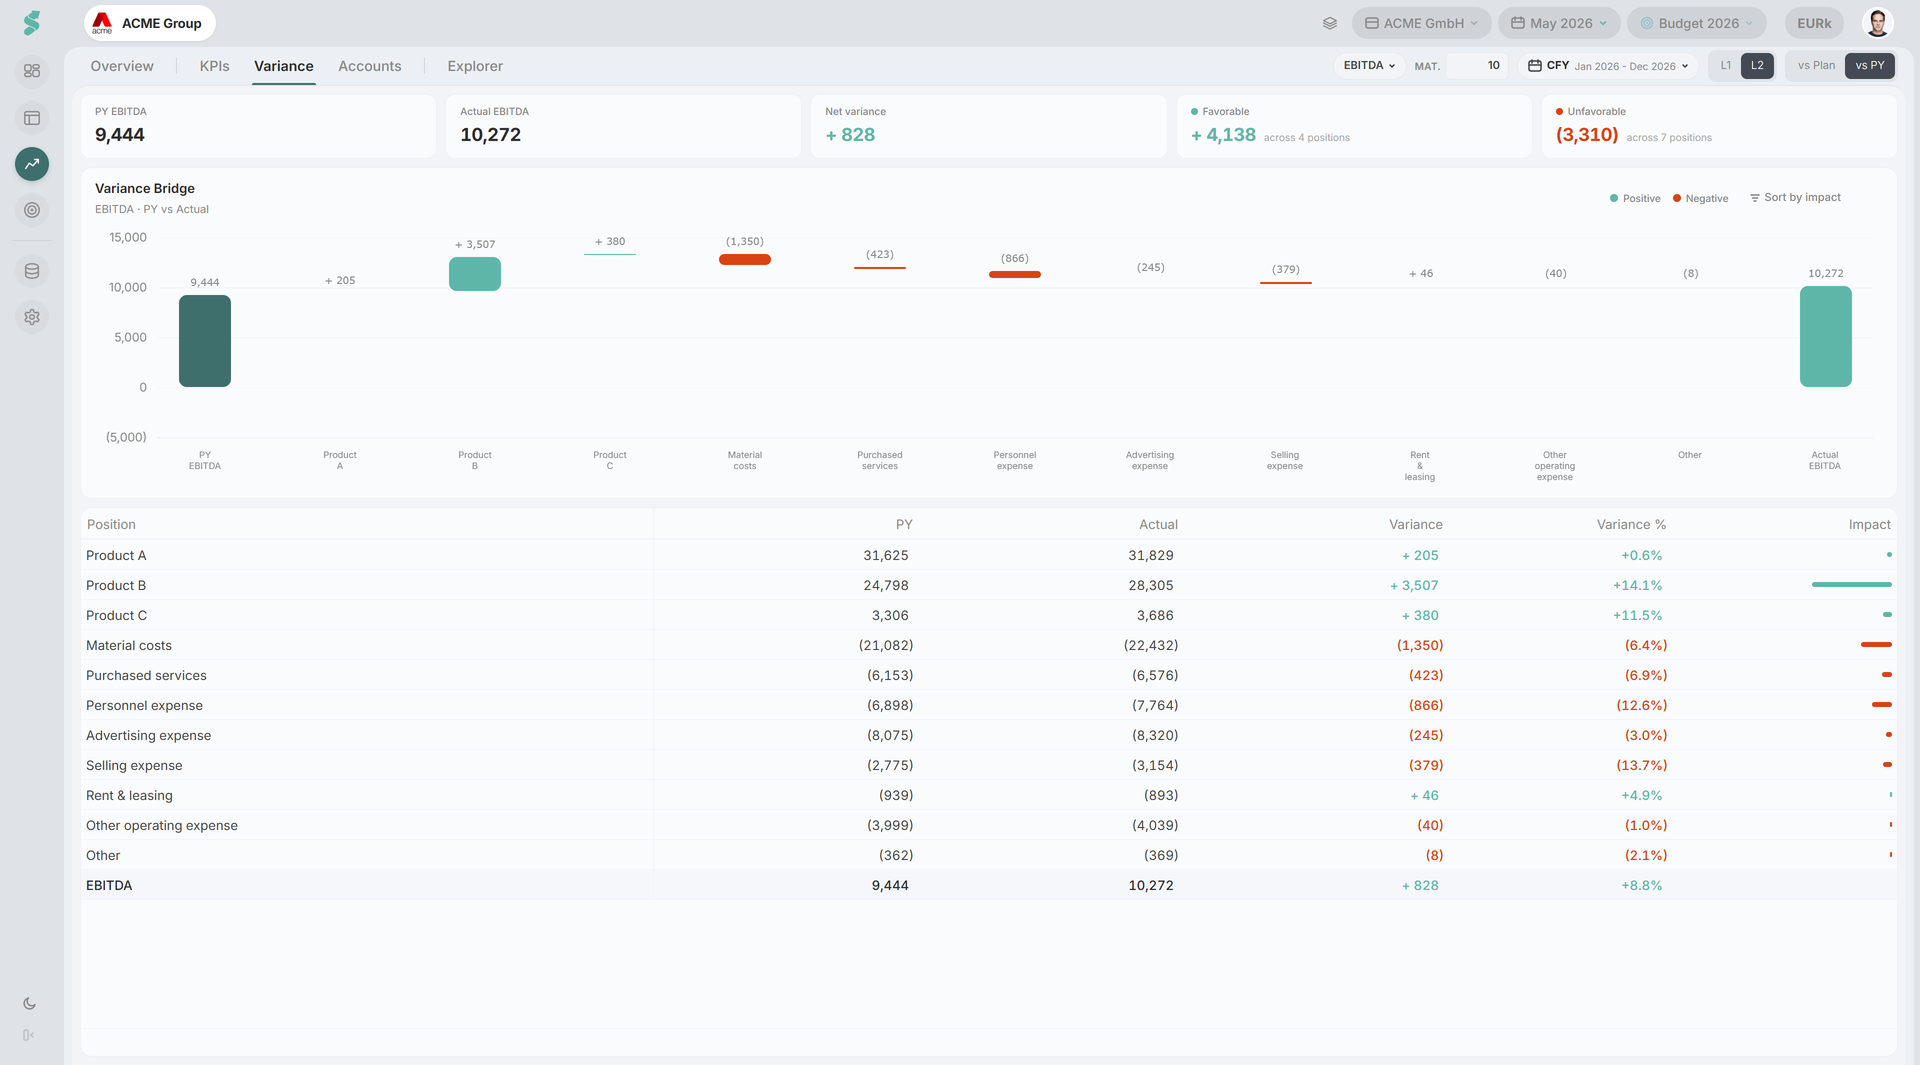
The Variance tab answers a single question: why is this number different from what we expected? It walks from a starting total (Plan or PY) to the Actual of a target KPI as a waterfall, with each P&L driver shown as a positive or negative step.
Use it to explain an EBITDA delta to the board in one chart, or to find the three drivers responsible for most of an EBIT miss.
TL;DR
A waterfall bridge from Plan or PY to a target KPI — resolve at L1 or L2, group small drivers into “Other”, read off the top contributors below.
How Variance works
Variance reads the same actuals + plan + range as the rest of Analysis. The selected target KPI defines the right-hand bar; statycs walks the P&L hierarchy at the chosen level and computes per-position variance against the chosen base. Drivers below the materiality threshold collapse into a single Other step so the chart stays legible.
The M/Y period toggle is hidden on this tab — Variance always works against the active range.
Variance elements
Subheader controls
- Target KPI — EBITDA, EBIT, Net income, Contribution margin I, or Total output.
- Mat. — materiality input (whole percent). Drivers whose absolute variance is below this threshold of the bridge collapse into “Other”.
- Range preset — same calendar pill as the rest of Analysis.
- L1 / L2 — how deep the bridge resolves. L1 stops at top-level P&L positions, L2 drills one level further.
- vs Plan / vs PY — the base side of the bridge. The starting bar reads “Plan EBITDA” or “PY EBITDA” accordingly.
Summary strip
Five cards above the chart: Plan / PY total, Actual total, Net variance, Favorable items (sum + count), Unfavorable items (sum + count). Favourable values are teal, unfavourable are red.
Waterfall chart
Plan/PY bar on the left, drivers in the middle (positive teal, negative red), Actual bar on the right. Sort by impact in the chart header reorders drivers by absolute variance. The download icon exports the chart as PNG.
Detail table
Below the chart, a grid with one row per driver plus a total row: Position, Plan, Actual, Variance, Var %, and an Impact bar scaled to the largest absolute variance. Same teal/red conventions as the chart.
Related
- Analysis — tab bar and shared controls
- Planning — the plan side of the bridge
- Financials — drill the same positions in statement view
- KPIs — define the target KPIs surfaced in the bridge