Planning
What Planning is for
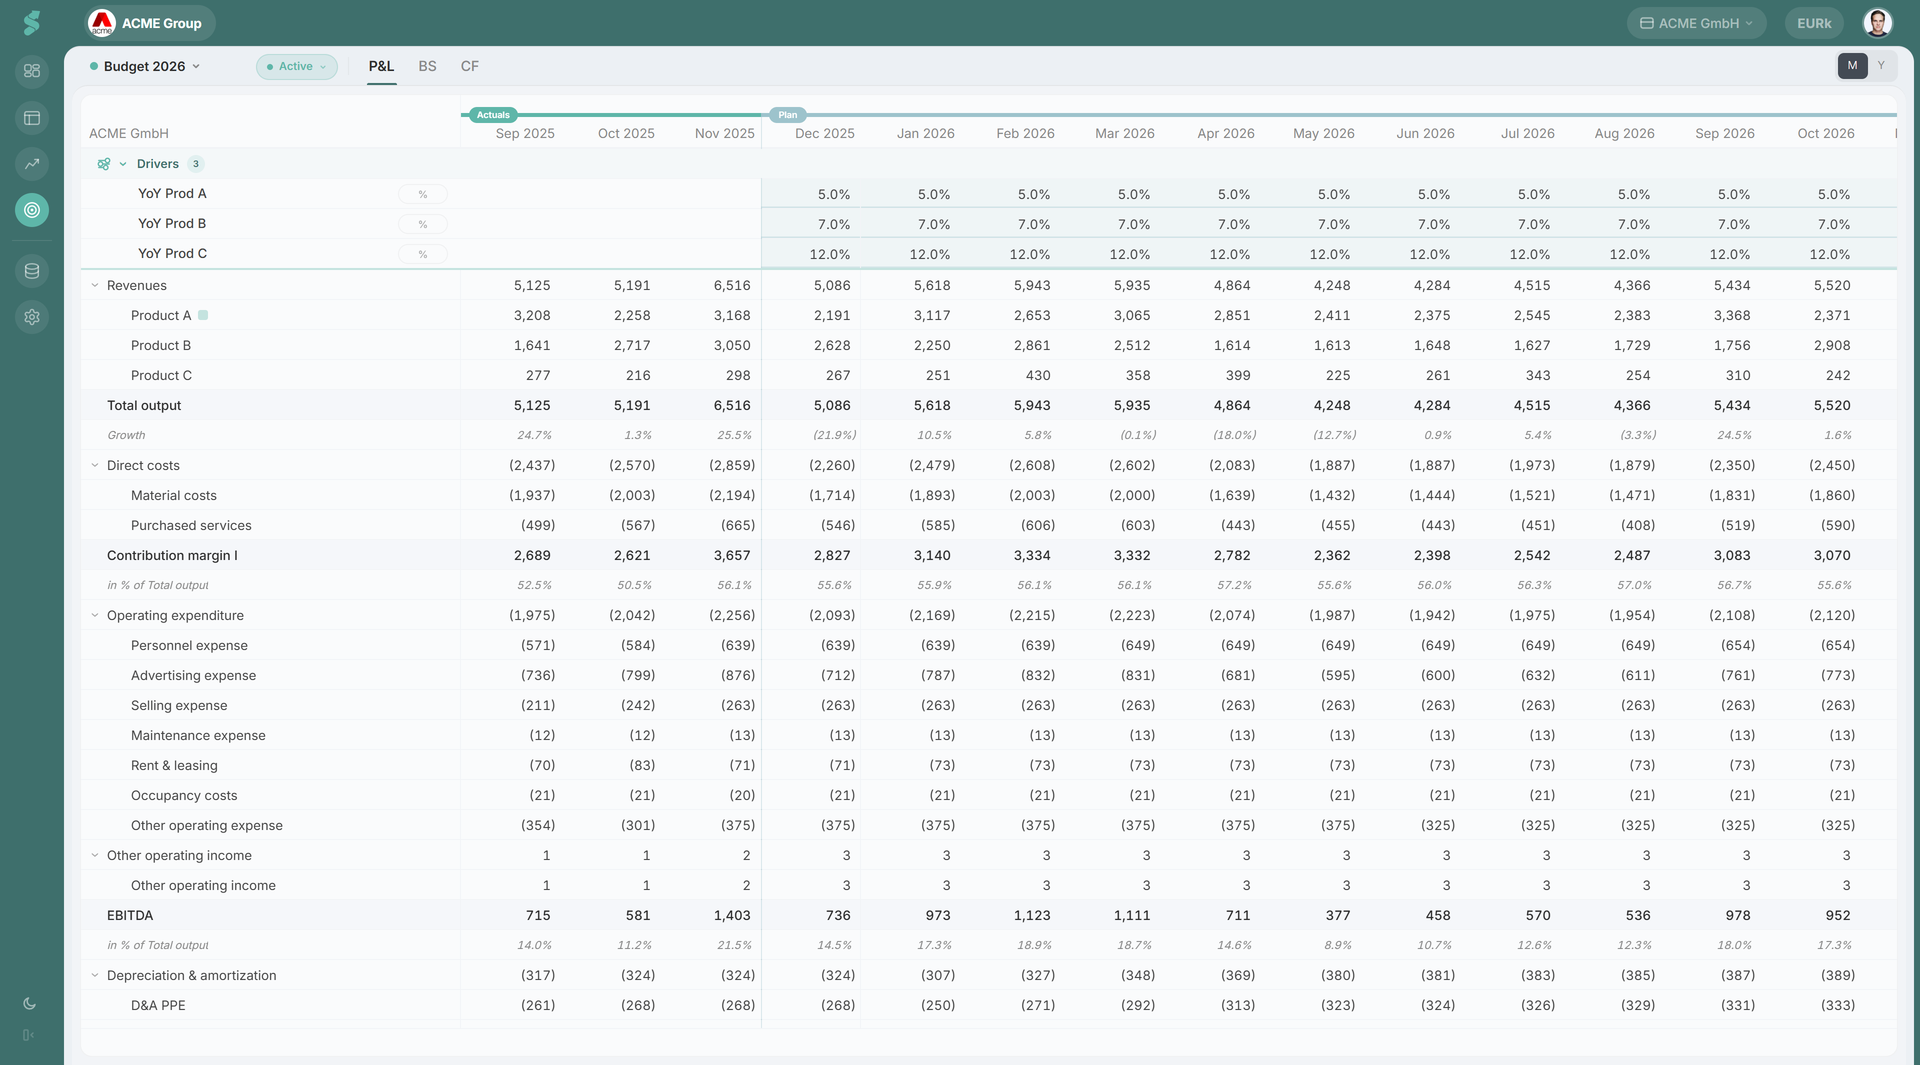
Planning is where you build the forward-looking view of the business: budgets and rolling forecasts. You plan in monthly cells across P&L, Balance Sheet, and Cash Flow, with full undo, copy/paste, and drivers — without leaving statycs for a spreadsheet.
TL;DR
Plans are edited in draft, activated when ready, and locked while active. You plan Level 2 only for both P&L and Balance Sheet — higher levels roll up; Cash & equivalents, Retained earnings, and P&L carryforward are calculated. Mark each L2 position open or done as you work through the plan.
How Planning works
The grid is the editing surface. Each row is a P&L, BS, or CF position; each column is a month. You can switch the period view between M (months) and Y (yearly aggregation, read-only) — there is no quarterly view in Planning.
Cells take a value, a formula, or a planning method. Methods compute values from your inputs; manual cells store values directly. Edits are stacked on an undo history and saved to the active plan only.
Planning elements
What you plan and what is calculated
You plan Level 2 positions only for both P&L and Balance Sheet. Everything above L2 (Subtotals, Level 1, Totals) is a roll-up — you cannot edit those rows.
A few L2 positions are also calculated, not planned:
- Cash & equivalents — derived from the cash flow statement.
- Retained earnings — accumulated net income from the P&L.
- P&L carryforward — the in-year carry from the P&L into equity.
These rows are read-only and labelled as auto-calculated. Cash Flow as a whole is derived from P&L + BS plan changes; you don’t enter Cash Flow values directly.
The set of available methods depends on the L1 anchor of the row. The method picker on each row only shows the methods available for that anchor.
Plan status — draft vs active
Each plan has a status that controls who can edit it:
- Draft — fully editable. Only draft plans can be edited at all. The current draft never feeds Financials, the Dashboard, or Analysis comparisons.
- Active — read-only and used everywhere. Activating a plan locks it; cells, methods, drivers — all immutable. Activating a plan automatically demotes the previously active plan to a versioned snapshot. Plan vs actuals deltas surface on the Dashboard, in Financials, and in Variance analysis the moment a plan flips to active.
Only admins can move an active plan back to draft so further edits can be made. Editors and viewers see active plans as read-only.
When you need to keep working on next-year’s numbers without touching the live one, create a new draft alongside the active plan, edit there, and activate the new one when ready (the previous active plan steps aside automatically).
Use New version on an active plan to clone it into a fresh draft alongside the live one — the new draft inherits the structure, methods, and drivers of the source, and selecting it automatically switches the planning view to the new draft so you can iterate.
Position status — open vs done
Each L2 position carries an open or done marker that you toggle as you work through a draft plan. It’s a personal-progress signal, not a permission gate — done rows still recompute when their inputs change. Use it to track which lines you’ve reviewed; the remaining open count is shown in the plan header so you can see how close you are to a complete pass.
Last actuals
Each plan has a fixed last-actuals month. Planning starts the month after. If the company’s actuals don’t line up with the plan’s last-actuals cut-off, statycs shows a warning symbol on the plan selector — re-version the plan or adjust the cut-off.
Plan visibility
Plans carry a PlanVisibleRole list controlling who can see them. Set visibility on creation, then change it later from the Edit plan modal — restricted plans never surface in role-filtered views or comparisons.
Period view (M / Y)
Toggle M for monthly editing, Y for a read-only yearly roll-up. Yearly aggregation follows the row type: P&L flow rows sum, BS stock rows take the last month, % rows average. See Drivers for the full aggregation rules.
Actuals window
By default the grid shows the last three actual months before the planning columns, so context is one glance away without crowding the editing surface. Toggle Show all actuals in the table menu to widen the view to the full actuals history of the plan year.
Cell editing — values, formulas, methods
You can enter a number directly, write a formula, or attach a method to the row. EUR cells store raw EUR. EURk cells display the value divided by 1000 for input and rendering — when you save, statycs multiplies by 1000 and stores EUR. Type the EURk value the way you read it; don’t pre-multiply.
Range edits, copy/paste, and Excel-style fill all work in the grid. All edits require the plan to be in draft.
The Cash Flow tab is read-only end-to-end: cash flow values are derived from P&L flows and Balance Sheet movements, so there are no editable positions, methods, or drivers on CF. Plan the inputs on P&L and BS instead. When a plan is dept-scoped (see Departments below), the Balance Sheet tab becomes read-only too, since BS / CF are central — only P&L is planned per department.
Planning positions within a Level 2
Most L2 categories aren’t a single line — Revenue is multiple streams, OpEx is many cost types. Click the + button on any L2 row to add a planning position under it. Each planning position carries its own method, can be renamed, and rolls up to the L2 total. Add as many as you need to mirror how the business actually thinks about the line; the parent L2 stays the value Financials and the Dashboard read.
Planning positions are different from formula helper sub-positions — see planning methods → Formula for that distinction.
New positions start in a Choose method state with no method selected — until you pick one, the row carries no values. See Planning Methods for the full list and how to choose.
For each L2 in edit mode, you can also pick a plan structure mode for how positions are organised: Custom positions (free-form), Account groups, Accounts, or — on fixed-asset lines — D&A / Capex. The account-driven modes anchor the structure to the chart of accounts; D&A / Capex opens a dedicated investment-and-depreciation editor (see D&A & Capex).
% of reference
Use the % of picker on an L2 row to compare the row to a reference. The default is Net revenues (nrev); change the reference per row from the picker (any L0 total or L1 expandable on the active statement is selectable).
Undo / redo
Edits are stacked on an undo / redo history. Ctrl+Z undoes the last action, Ctrl+Y or Ctrl+Shift+Z redoes it; the same actions are also available from the table menu. The history is per session — closing the tab or reloading the app drops it.
Drivers panel
A collapsible panel at the top of the grid hosts reusable drivers (headcount, prices, churn, lease flags) that feed positions and sub-positions. Toggle it from the table menu. See Drivers.
Loans, depreciation & capex
Two specialised flows handle asset and financing schedules directly in the grid:
- Loans — set a Balance-sheet Financial-liabilities line to the interest-bearing method to model a loan (manual, annuity, or PIK). statycs injects the loan’s balance, change, and interest rows and mirrors an interest-expense line under Net interest. See Loans.
- D&A & Capex — set a fixed-asset line to the D&A / Capex structure to plan investments and depreciation with a rolling PPE balance. See D&A & Capex.
Departments
With the Departments add-on enabled, a plan can be marked Plan by departments at creation (the checkbox is locked otherwise with a billing prompt). The grid then exposes a plan scope pill in the subheader that switches between Company (rolled-up totals) and a single department; departmental edits roll up into the company total.
In dept scope, the P&L truncates at EBITDA — Depreciation & amortization, Net interest, EBT, Tax expense, and Net income roll up centrally — and an Investments block appears below for capex, sales, and useful-life entries per fixed-asset L2. Balance Sheet and Cash Flow tabs are disabled in dept scope (those numbers stay central).
Notes
Attach a note to any planning row. See Notes in Planning.
Excel round-trip
Export a plan to .xlsx, edit offline, and re-import. See Plan Import / Export.