Drivers
What Drivers are for
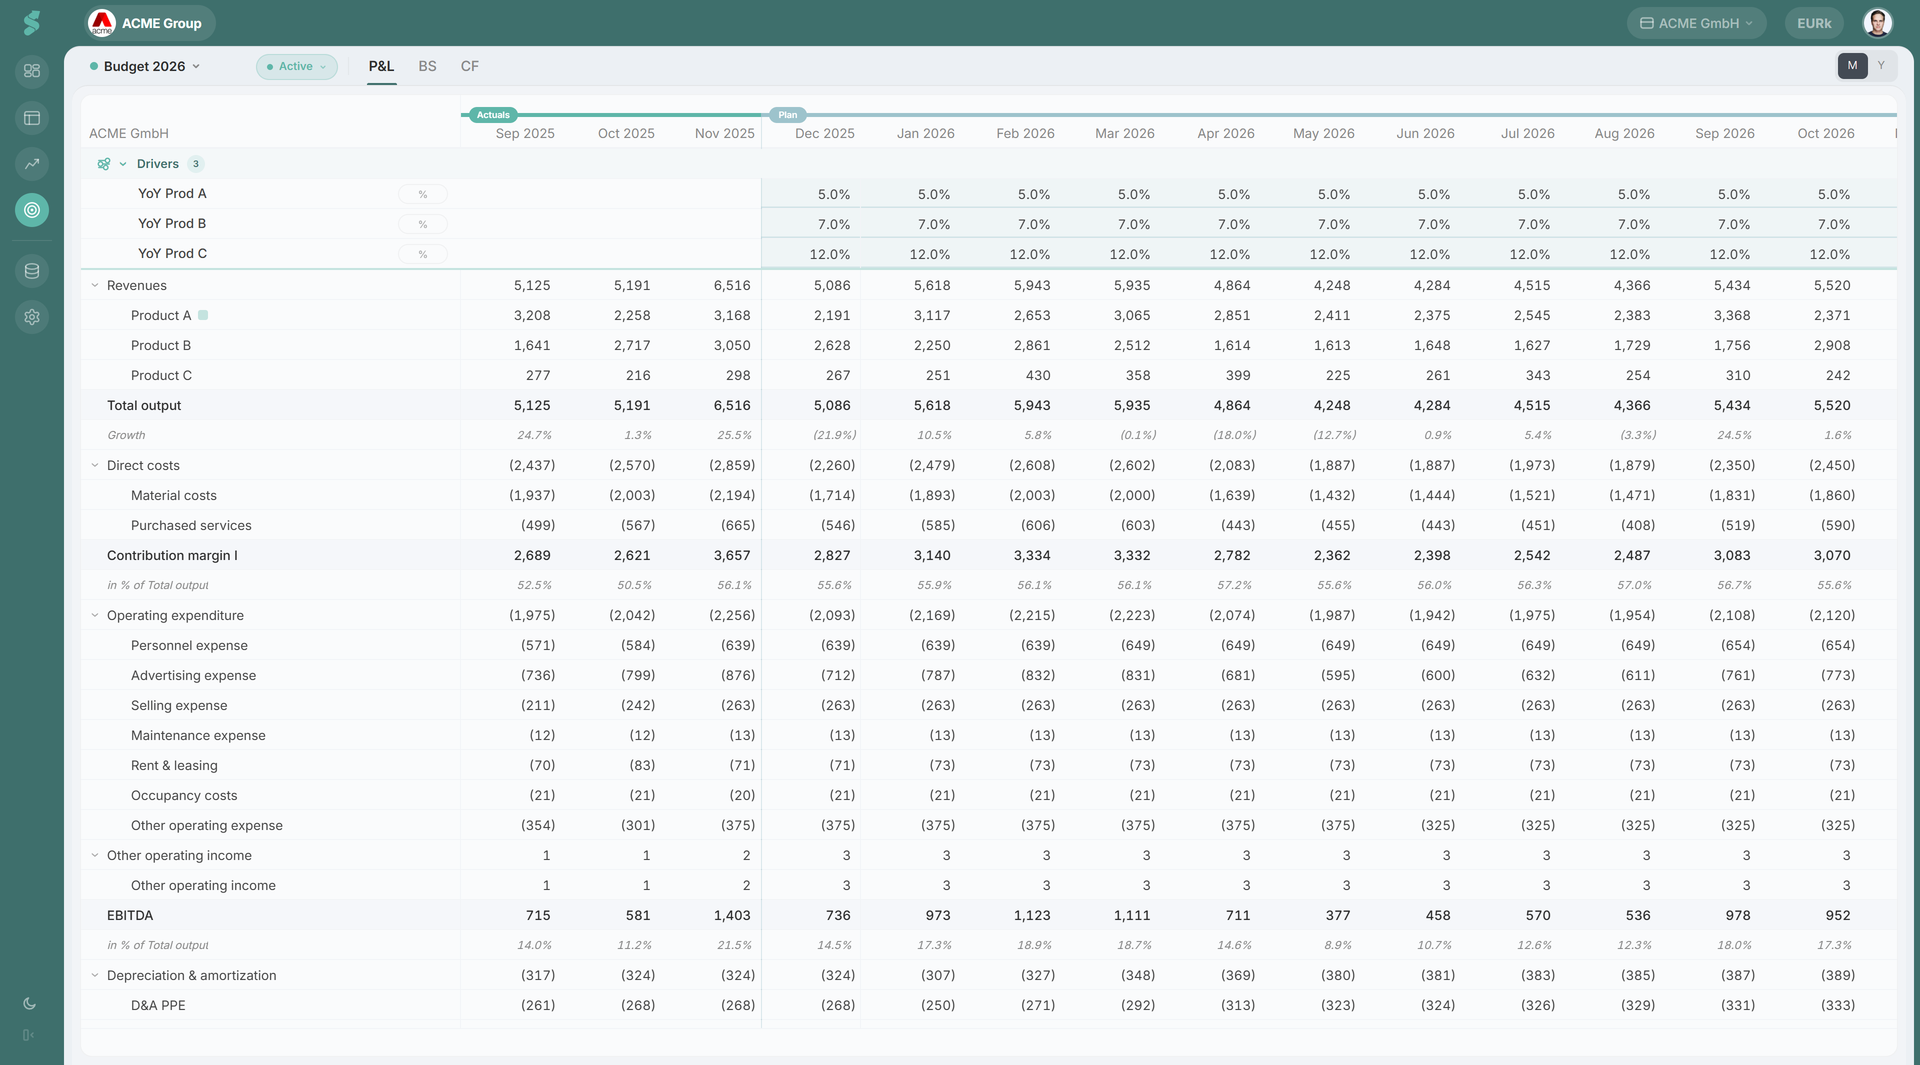
Drivers let you plan once and reuse everywhere. Headcount, prices, churn, conversion rates, lease flags — define them in the Drivers panel and reference them from any planning row, sub-position, or formula. Edits to a driver propagate to every consumer in the active plan.
TL;DR
Drivers live in a collapsible teal row at the top of the planning grid. Pick a unit type (Currency / Value / Percentage / Boolean), a per-driver method (Manual / Formula / Annual growth / Custom), and reference the driver from any row. Yearly aggregation follows the unit (Sum / Last / Average).
How Drivers work
The Drivers panel sits above the statement rows in the Planning grid. Toggle it from the table menu (the panel hides when not needed so the statement rows stay focused).
Each driver is a labeled time series with a unit type. Drivers don’t appear in the statements — they exist to feed positions, sub-positions, and formula references.
Driver elements
Unit types
- Currency (EURk) — currency, displayed in thousands. The stored EUR value is divided by 1000 for display and multiplied back on save.
- Value (#) — a count or absolute number, no scaling.
- Percentage (%) — stored as a fraction, rendered with one decimal.
- Boolean (0/1) — used for payment schedules, lease activation, trigger flags.
Per-driver methods
Each driver has its own method, set independently of the rows that consume it:
- Manual — enter monthly values directly.
- Formula — compute from other drivers, rows, or constants.
- Annual growth — annual rate distributed by a seasonality profile.
- Custom — driver-specific patterns (for example, schedule booleans).
Sub-position roll-up
Drivers feed both sub-positions (helper lines under a formula-based row) and the parent row itself. Sub-positions don’t roll up to the L2 on their own — they exist to make the parent’s formula readable. The parent’s computed value is what contributes to L1 and totals.
Yearly aggregation
When you switch the grid to Y view, statycs aggregates each driver and each row using a rule chosen by row type:
- Sum — P&L flow rows (revenues, costs, opex). Default for non-percentage rows on the P&L.
- Last — Balance Sheet stock rows. The yearly value is the last month’s value.
- Avg — percentage rows. The yearly value is the simple average of monthly percentages.
By default, percentage rows take the average across months, Balance Sheet rows take the last month’s value, and all other rows are summed. The aggregation symbol (Σ / Last / ⌀) appears next to the driver label so you can see at a glance how the yearly value rolls up.
Toggling the panel
Open or close the Drivers panel from the table menu in the grid header. The panel state is per-plan, not global, so different plans can present different driver sets.
Editing drivers
- Add: click the + at the bottom of the panel.
- Rename: double-click the driver label.
- Remove: row menu → Delete.
- Bool drivers: cells toggle 0/1 by click; manual bool cells stay editable, formula-driven bools are read-only.
Deleting a driver breaks every formula that referenced it — the consuming positions show a broken-reference error in the formula editor and in the validation sub-navigation. Fix or remove the references before deleting, or use the validation list to walk back through the affected rows after the fact.
Planning a manual KPI
A manual KPI — order entry, pipeline, headcount you type in by hand — has no statement line behind it, so nothing in a plan moves it. Linking fixes that: declare a driver to be the plan series of a manual KPI, and the KPI gains a forward view it could not have on its own.
How to link
On the driver’s row menu choose Link KPI and pick from the Manual KPIs list. Only manual KPIs appear; calculated ones already derive from the statements. A KPI already used by another driver in the same plan is shown as Already linked in this plan — one driver per KPI, per plan.
What linking changes
The KPI takes over the parts of the driver that describe it, and the driver keeps the part that plans it:
- Name, unit and aggregation come from the KPI. The driver label shows Linked to KPI, and renaming and the unit menu go read-only — the unit tooltip reads Unit comes from the linked KPI.
- The KPI keeps its history. Its actuals fill the driver row’s actuals columns, which sit empty on an unlinked driver. A KPI with no history yet is listed as no actuals yet — you can still link it.
- The driver owns the forward months. Whatever you plan there becomes the KPI’s plan series, rolled up to the year by the KPI’s own aggregation, not the driver’s.
Because the link lives on the driver, it is plan-scoped: the same KPI can be planned differently in Budget and in Forecast, and switching scenarios never edits the KPI itself.
Removing and repairing
Choose Remove link to unlink. The driver keeps its values and its label becomes editable again; the KPI keeps its history and simply loses the forward series.
If the KPI is deleted while a driver still points at it, the driver shows The linked KPI no longer exists in amber. The driver and its numbers are untouched — relink it to another KPI, or remove the link.
Tip
No manual KPIs to pick from? The picker says No manual KPIs yet. Create one in Analysis → KPIs. Manual KPIs are created on the KPIs tab; only then can a driver plan one.
Referencing drivers
Open the formula editor on the consuming position and pick a driver from the browse picker (drivers appear in their own category alongside P&L, BS, and CF references). You can also click directly on a driver row in the grid while the editor is open to insert it as a reference. Each reference takes a time offset chosen from a small menu — this month, previous month, 1 year ago, or Custom (which opens a modal where you pick a month count and direction). The same offsets work for cross-row references.
Related
- Planning
- Planning Methods
- Formula syntax
- KPIs — where manual KPIs are created, and what a linked driver plans