Onboarding
Every new organization follows the same onboarding flow to ensure clean data, consistent financial statements, and reliable analytics. This setup is mandatory and takes only a few minutes.
TL;DR
Upload a trial balance, design your statements, map your accounts. Ready in under 10 minutes.
1. Upload Data
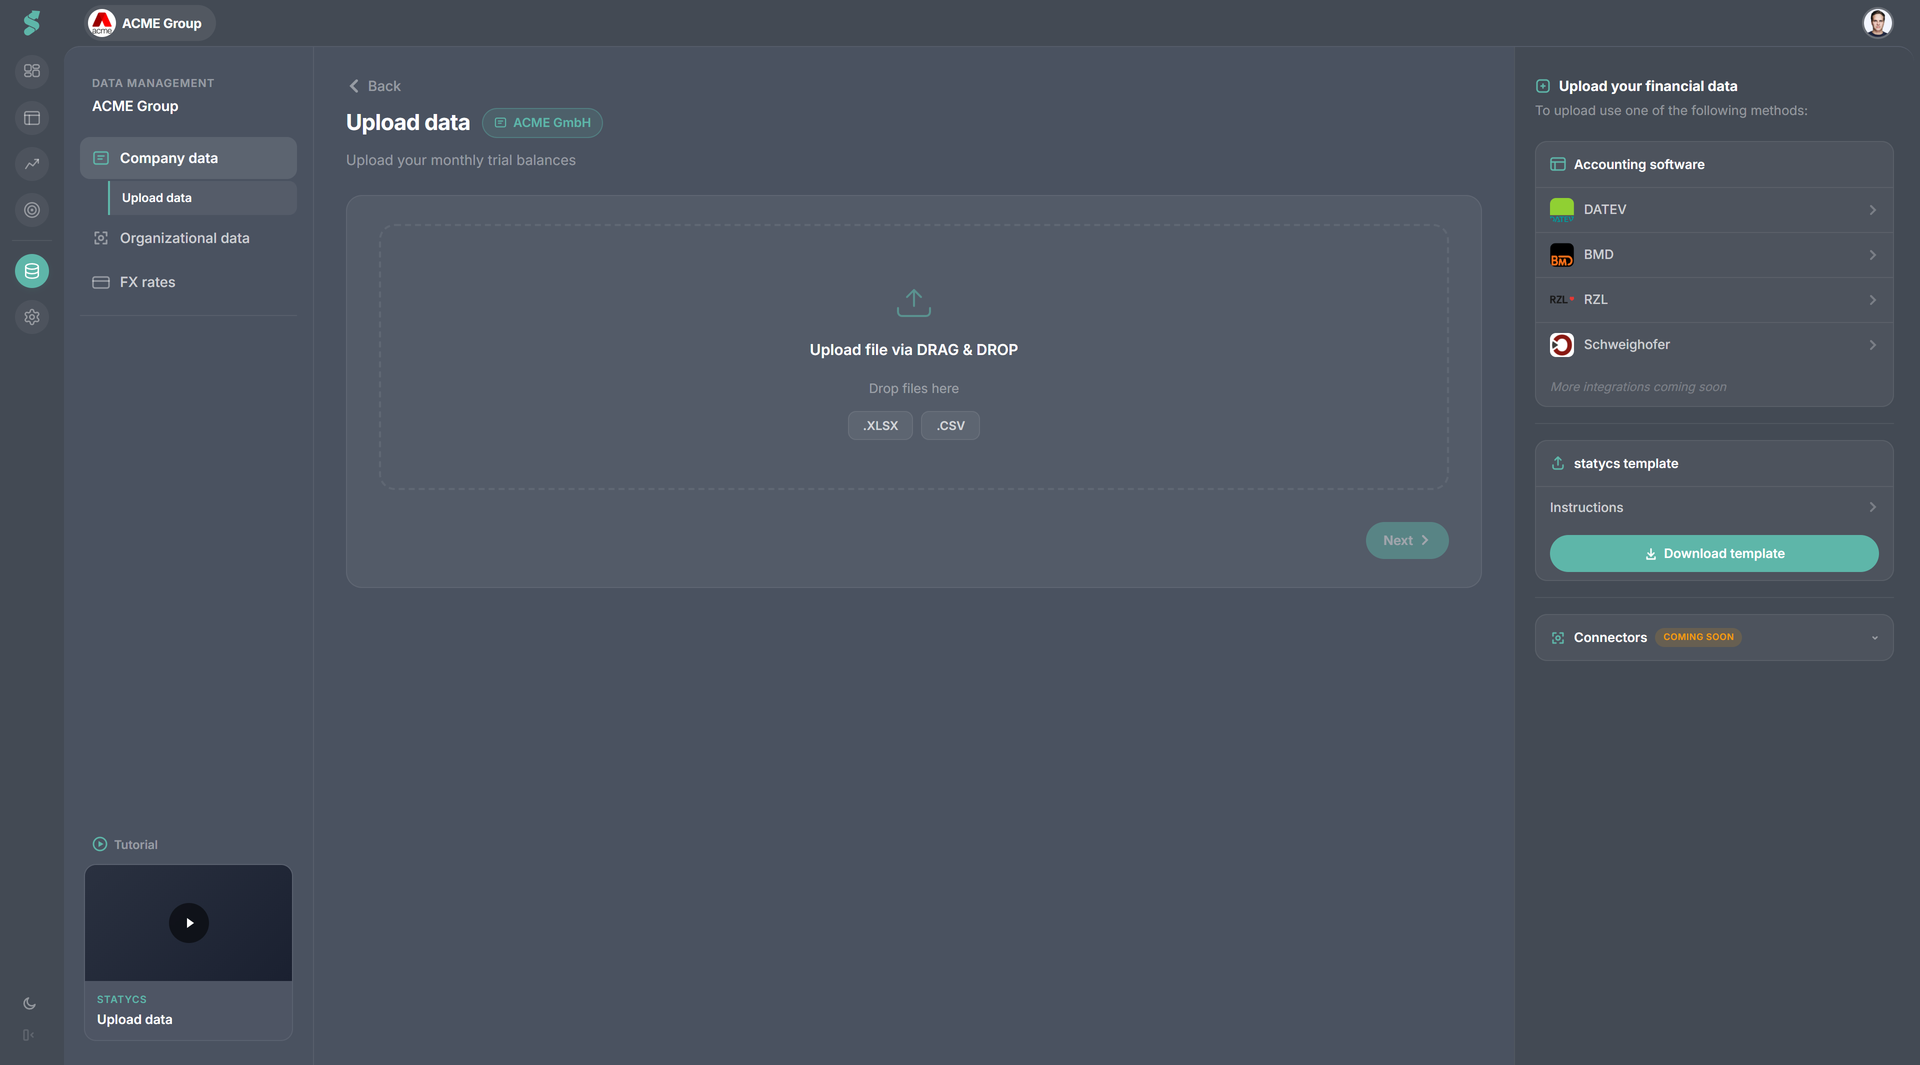
What you do
- Upload your trial balance using supported formats
- Define company name, fiscal year-end, industry, and currency
Why it matters
- Standardized imports prevent format and structure issues
- Clear guidance ensures correct exports and templates
Formats & inputs
- Additional input formats and integrations will be added continuously
- The onboarding flow remains the same for all future inputs
Validation
- Unsupported formats trigger an error with clear instructions
- You can only continue once a valid trial balance is detected
2. Design Financial Statements
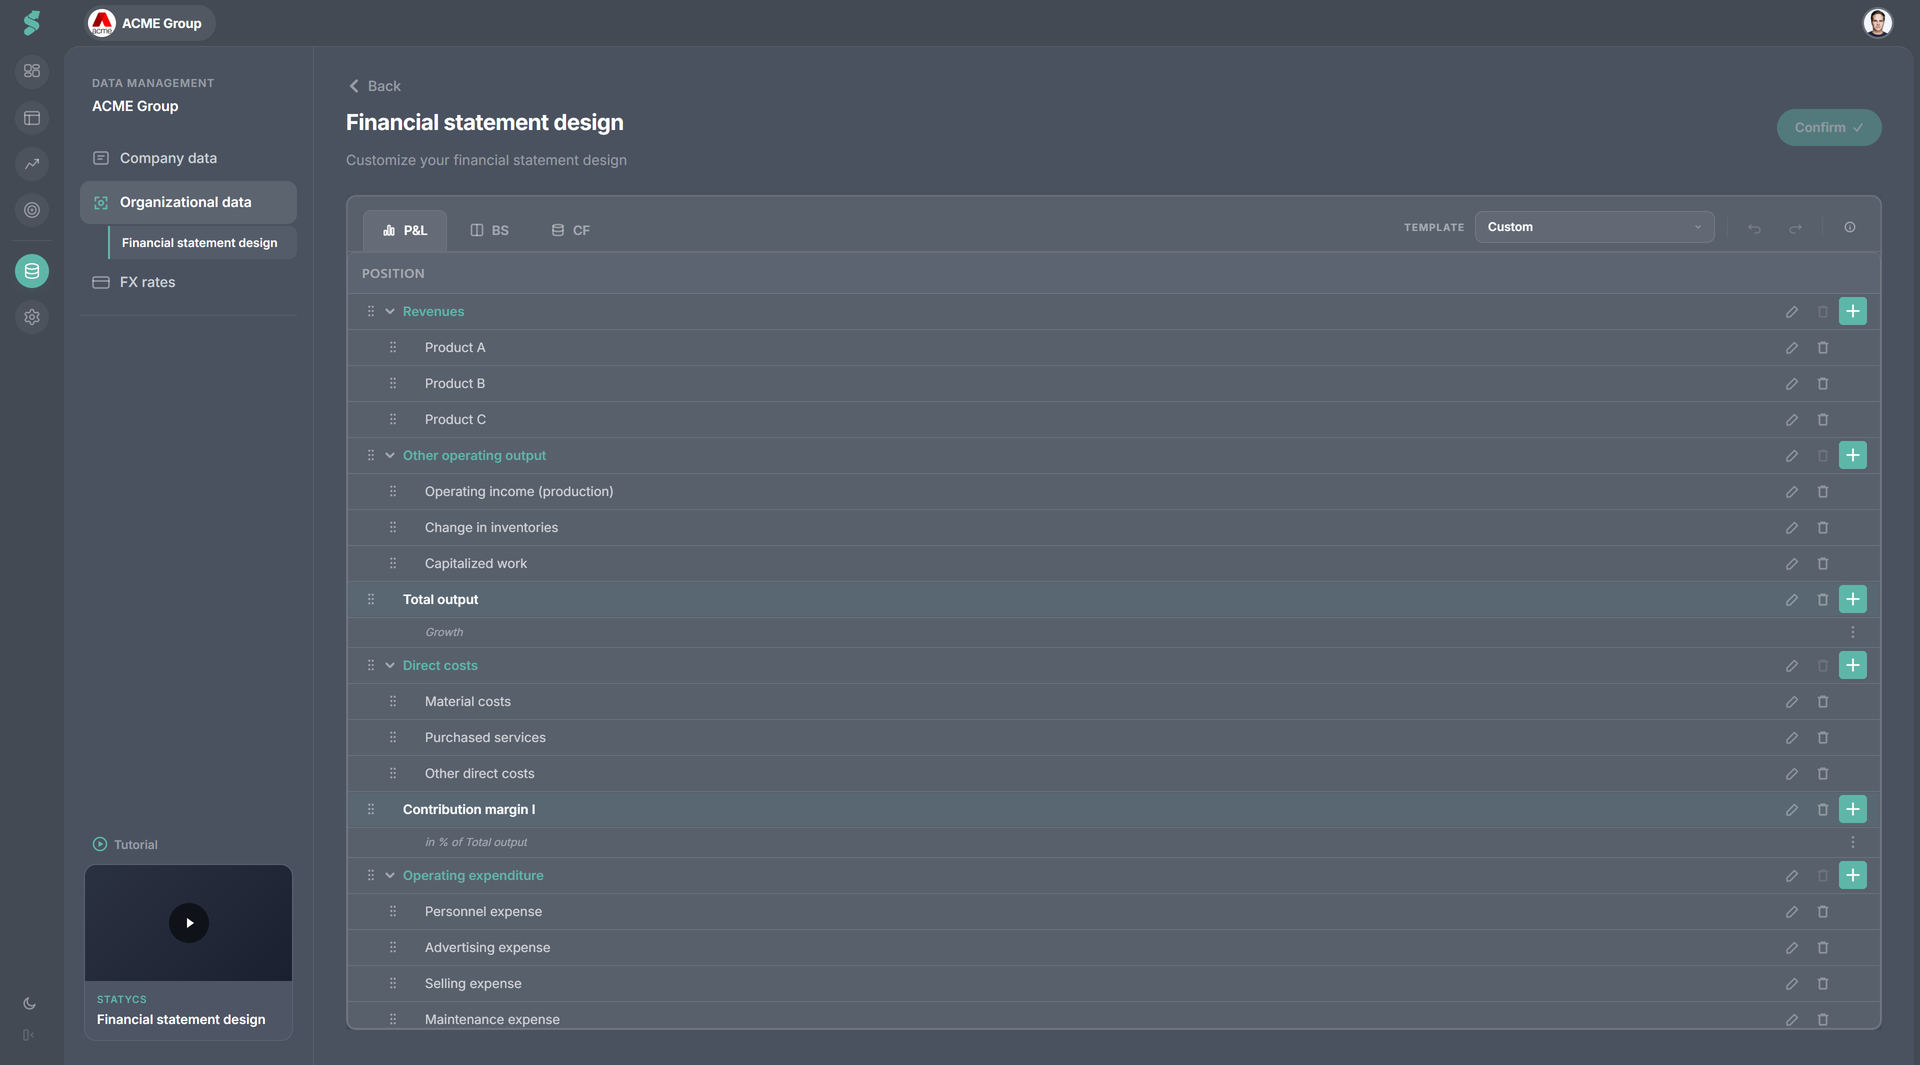
What you do
- Define the structure of your P&L, Balance Sheet, and Cash Flow
- Add and arrange Totals, Subtotals, Level 1, and Level 2 positions via drag & drop
- Start from templates or extend the predefined structure
Why it matters
- Reporting reflects your business logic - not your chart of accounts
- A consistent structure enables clean analysis and planning across all companies
You can refine Level 2 positions and account groups later. The goal at this stage is to establish a solid, consistent structure.
Hierarchy of Financial Data
statycs structures financial data in a clear, multi-level hierarchy. This ensures consistency, transparency, and reliable analytics across all reports and planning models.
- Totals
- Subtotals (BS & CF only)
- Level 1 Positions
- Level 2 Positions
- (Optional) Account Groups
- Accounts (Trial Balance)
- (Optional) Account Groups
- Level 2 Positions
- Level 1 Positions
- Subtotals (BS & CF only)
From top to bottom, the hierarchy works as follows:
Totals Examples: EBITDA, Total assets High-level aggregations that summarize multiple subtotals and positions.
Subtotals (Balance Sheet & Cash Flow only) Examples: Provisions, Current assets & accruals Intermediate aggregations used in Balance Sheet and Cash Flow statements to group related positions.
Level 1 Positions Examples: Revenues, Fixed assets Predefined reporting categories that form the backbone of your financial statements.
Level 2 Positions Examples: Personnel expense, PPE Customizable positions where you structure your business-specific reporting.
(Optional) Account Groups Optional grouping layer between Level 2 positions and individual accounts. Used for better structuring, analysis, and planning drivers.
Accounts Imported directly from your trial balance. These are the lowest-level data points in the hierarchy.
Mapping Rule
Accounts are always mapped to Level 2 positions. Mapping to Totals, Subtotals, or Level 1 positions is not possible.
This ensures a consistent structure and enables reliable analysis and planning.
Predefined Level 1 positions
Level 1 positions are predefined to ensure standardized financial logic and reliable analytics. These positions cannot be removed.
P&L
- Revenues
- Other operating output
- Direct costs
- Operating expenditure
- Other operating income
- Depreciation & amortization
- Net interest
- Other income / loss
- Non-recurring items
- Tax expense
Balance Sheet
- Fixed assets
- Inventory
- Trade receivables
- Other assets
- Cash & equivalents
- Equity
- Provisions
- Financial liabilities
- Trade payables
- Advance payments received
- Other liabilities
Level 2 positions and account groups are fully customizable within this structure.
Automatic logic & fixed positions
Certain positions include built-in logic to ensure consistent financial calculations.
- Level 2 positions under Fixed assets automatically generate CapEx, depreciation, and cash flow entries
- Positions under EBITDA populate “Other cash flow” entries
Fixed (non-editable) positions
- EBITDA
- Net income
- Total assets
- Total liabilities & equity
- Cash & equivalents
- Retained earnings / P&L carryforward
- Non-categorized (placeholder for unmapped accounts)
3. Map Accounts
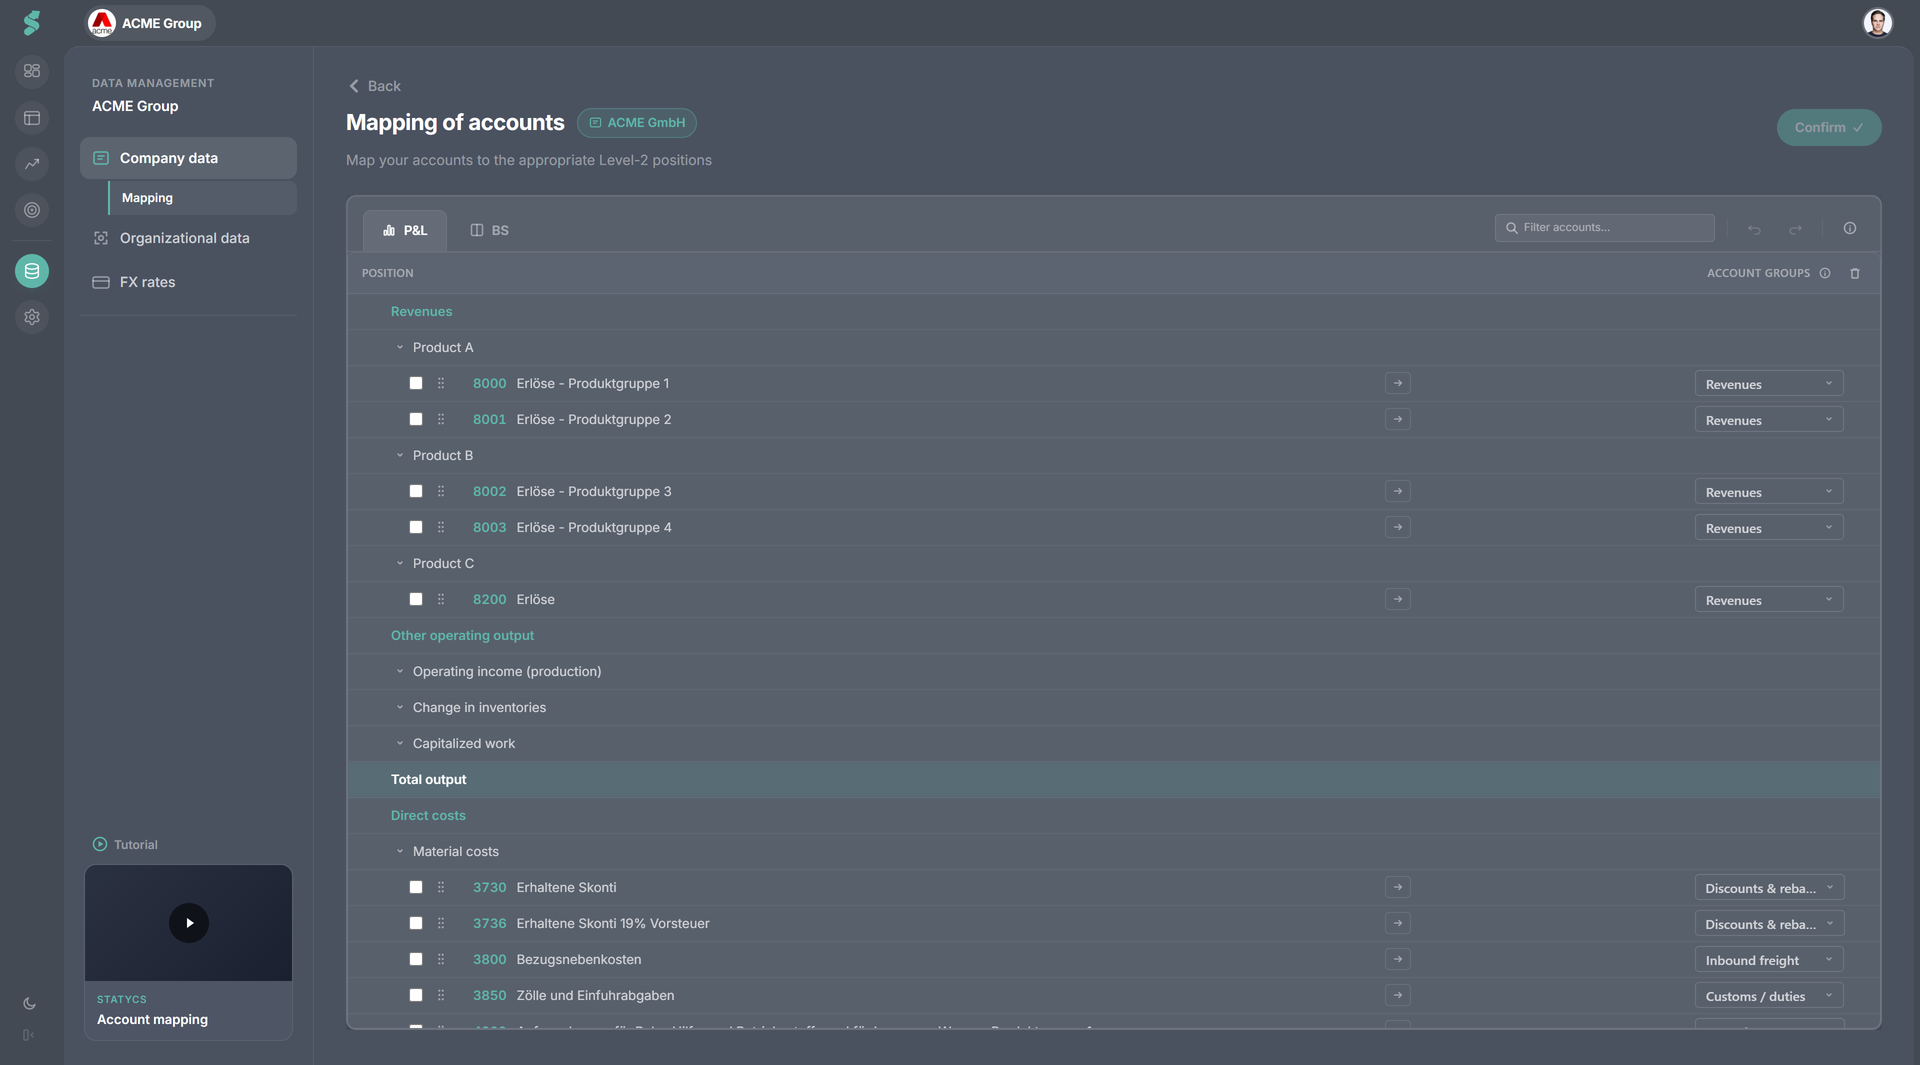
What you do
- Map trial balance accounts to Level 2 positions
- Create account groups as an intermediate structural layer between Level 2 positions and individual accounts
- Review and adjust auto-mapping (supported charts of accounts are recognized)
- Tag net debt and intercompany accounts
- Split debit and credit balances if required (e.g. negative receivables treated as liabilities)
Why it matters
- Automatic mapping reduces setup effort significantly
- Warning indicators immediately highlight unmapped accounts
- Correct structure and tagging prepare your data for analysis and planning
Account groups
Account groups are a structural layer between Level 2 positions and individual accounts. They improve grouping, enable cleaner analysis, and serve as drivers in planning.
Account groups are reused consistently across Financials, Analysis, and Planning.
Automapping & new uploads
- For supported accounting schemas, accounts are mapped automatically — the matcher runs server-side as part of the upload
- For previously mapped companies, new uploads that contain new or unknown accounts place those accounts automatically into Non-categorized
- This allows you to immediately identify and map new accounts correctly without affecting existing mappings
- Automapping coverage will be expanded continuously as more accounting schemas are supported
Per-department overrides (Departments add-on)
With the Departments add-on on, P&L accounts can carry per-department overrides: the same account routes to a different Level 2 depending on which department booked the GL line. Open the Departments popover next to any P&L account to add or edit overrides — for example, a shared overhead account that lands in Direct costs for Production but Operating expenditure everywhere else.