KPIs
What the KPIs tab is for
The KPIs tab is the catalogue of every metric statycs computes for a company — both the built-in ratios and the custom KPIs you define yourself. It is the single place to read the current values, rename a KPI, or build a new one that should then be available everywhere else: the Dashboard picker, Variance target list, Chart Builder, and Reports.
TL;DR
A grouped table of all KPIs, locked to yearly P-mode, with an editor pencil for adding manual or formula-based custom KPIs that flow through the rest of statycs.
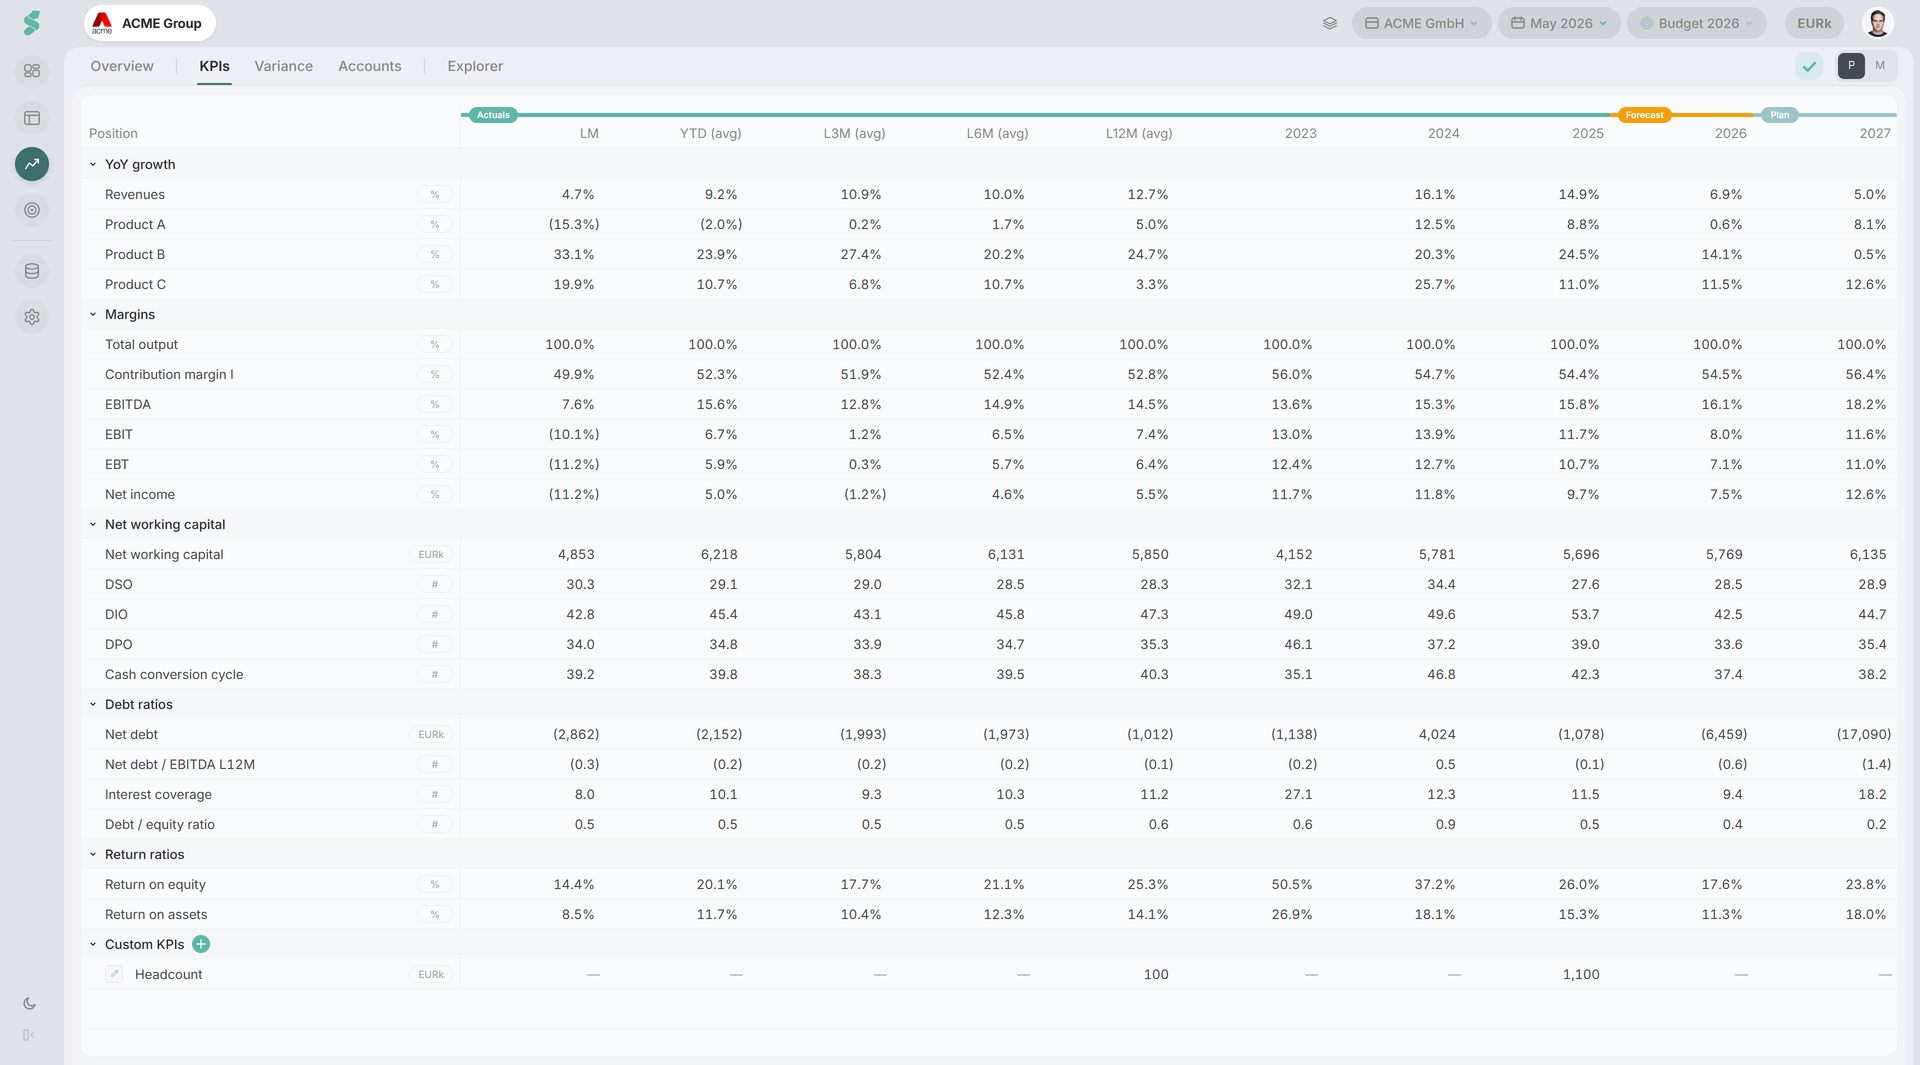
How the KPIs tab works
The tab is one of the fixed tabs inside Analysis. Opening it forces the period toggle to P (yearly periods) and restores your previous mode when you leave — there is no quarterly view, and the M/Y toggle is replaced by a P/M toggle while you are on this tab.
Rows are grouped into collapsible sections (Growth, Margin, NWC, Debt ratios, Custom KPIs). Columns reuse the Financials pattern: Actuals / Forecast / Plan pills above the column groups, range driven by the selected plan and last-actuals month.
Edit mode is independent of the chart-view edit mode — the pencil only affects the KPIs tab, and clicking it toggles the editor regardless of what is happening on Overview or other tabs.
KPIs tab elements
Built-in groups
Built-in KPIs are grouped into Growth, Margin, NWC, and Debt ratios. Click the chevron on a group header to collapse or expand it. Built-in rows are read-only; hover any row for a tooltip with the formula.
Custom KPIs group
The bottom group is yours. With edit mode on, the group header gains a + button — click it to add a new KPI (default label “New KPI”, method “Choose method”, unit EURk).
Each custom row carries three controls in edit mode:
- Method pill — Manual or Formula
- Unit badge — Currency (EURk), Value (#), Percentage (%), Boolean (0/1)
- Trash icon — delete
Manual method
Pick Manual and the tab auto-switches to M view so you can type one value per month into the Actuals columns. Values are saved per cell as you tab out. Use Manual for KPIs that statycs cannot derive (NPS, headcount targets, qualitative scores).
Formula method
Pick Formula and the formula editor overlay opens under the active row. You build an expression from typed tokens:
- Operators —
+ - x / ^and parentheses - Numbers
- References — to positions, sub-positions, accounts, drivers, or other KPIs, picked via the same P&L / BS / CF / KPIs categories used elsewhere in statycs
- Time offsets — same syntax as planning formulas
Saved formulas evaluate per period and feed the Actuals / Forecast / Plan columns automatically.
Renaming KPIs
Double-click a custom KPI’s name in edit mode to rename it. KPI names are language-specific — to provide a translation, switch the app language and rename again. Built-in KPI names come from the catalogue and cannot be renamed.
Deleting KPIs
The trash icon removes a custom KPI immediately. This also removes it from every Dashboard, Report, Variance target, and Chart Builder reference that pointed to it — confirm before deleting.
Scope and inheritance
Custom KPIs are scoped per company. A new sibling company under the same parent starts with the KPI list of an existing sibling and then evolves independently — later edits stay local to that company.
Related
- Analysis — parent workspace and tab bar
- Chart Builder — reference custom KPIs in custom charts
- Dashboard — surfaces custom KPIs in the picker and KPI sidebar
- Financials — source data for formula references
- Formula syntax — operators, references, time offsets