Group consolidation
What group consolidation is for
Group consolidation rolls the companies of your organization up into one group: one P&L, one balance sheet and one cash flow, in one currency, with the balances and flows between the companies taken out. It is a management view of the group for reporting and analysis, not a statutory consolidation.
It is included at no extra cost once an organization has two or more companies.
TL;DR
An admin sets the group up once under Data → Organizational data: the companies, the parent, the ownership, the group currency and the intercompany positions. After that, Group is the first entry in the company picker; Dashboard, Financials and Analysis show the consolidated group, and Planning holds group plans.
How group consolidation works
Every month, statycs translates each company’s actuals into the group currency and adds them up. It then removes what the companies owe each other and sell to each other — in the positions tagged in the setup — and eliminates the parent’s investment against the subsidiaries’ capital. Nothing extra is uploaded: the group is built from the companies’ own data.
- Full consolidation. Every company in the group counts at 100%, however much of it the parent owns. The ownership only splits the group’s equity and net income between the parent’s owners and the non-controlling interests (the minority).
- Intercompany positions. In the group, the positions tagged under Profit & loss and Balance sheet in the setup are removed in full, for every company. Whatever does not cancel out stays in the group as an IC elimination difference. A position tagged there must therefore hold intercompany amounts only — if it also holds amounts with outside parties, such as receivables from customers next to receivables from group companies, give those a position of their own first.
- Capital consolidation. The parent’s investment in a subsidiary is eliminated against the parent’s share of the subsidiary’s capital, and the difference goes to the consolidation reserve. Only the positions tagged as the subsidiaries’ capital are eliminated, and only at the parent’s share; the minority’s share of them goes to the non-controlling interests. A subsidiary’s other equity — reserves and results — stays in group equity, with the minority’s share in the non-controlling interests.
- Dividends. Dividends the parent books in the positions tagged as dividend income from subsidiaries are taken out of the group’s profit: the group already counted that profit when the subsidiary earned it. That list is empty until you tag a position in it.
- Exchange rates. The P&L is translated at each month’s average rate and the balance sheet at the month’s closing rate. Equity is translated at historical rates: the equity a company has when it joins the group is translated at the closing rate of its first month in the group, and every later change at the average rate of the month in which it happened. The translation difference goes to the FX translation reserve.
- Fiscal year. The group reports in the parent’s fiscal year.
- Group months. The group starts with the parent’s first month of data. Each company joins with its own first month of data, or with the parent’s first month if its data starts earlier. A month is consolidated only once every company that belongs to the group in that month has delivered it, so the group’s latest month is the latest month that all of them have delivered.
- Bought subsidiaries. A bought subsidiary is treated as if the parent had founded it, with its whole uploaded history; a price paid above the parent’s share of the subsidiary’s capital lowers the consolidation reserve. It shows as goodwill only when the amount is entered in the setup — see Goodwill below. To leave out the time before an acquisition, upload that company’s data only from the acquisition month on: its results before that month then stay out of the group’s P&L, but its reserves and earlier results at that month still count as group equity. If that month is not the start of the company’s fiscal year, the upload must carry the result of the earlier months of that fiscal year in the P&L carryforward, or the company’s books do not balance.
- Cash flow. The group cash flow is derived from the consolidated P&L and balance sheet, the same way a company’s is. Each company’s balance-sheet movements are translated at the month’s average rate, so exchange-rate moves never read as cash flows. The group’s first month has no cash flow.
Group consolidation elements
Who can use it
Only an organization admin sets up the group, changes it and maintains its exchange rates. The Group entry in the company picker is shown to admins and to users who have access to every company of the organization and are not limited to departments — there is nothing to tick for it. Group dashboards, group views, group KPIs and group plans are changed by admins only — everyone else who sees the group can read them.
Setting up the group
Once an organization has two or more companies, the Consolidation card on Data → Organizational data starts the setup. The setup has four steps:
- Basics — tick the companies that belong to the group, choose the parent with Set as parent, enter the parent’s Ownership of each subsidiary, and choose the Group currency. Every company is translated into it.
- IC accounts — tag the positions that consolidation eliminates. statycs suggests a first selection from your statement structure (IC receivables and IC liabilities for the balance sheet, Financial assets for capital consolidation, and Equity for the subsidiaries’ capital); check it before you continue — if Financial assets also holds securities or other investments, move those to a position of their own first. The step has five lists, followed by an optional Goodwill section (see below):
- Profit & loss — income and expenses between the companies.
- Balance sheet — balances between the companies, such as receivables, payables and loans.
- Capital consolidation — where the parent holds its shares in the subsidiaries. At least one position is required.
- Subsidiaries’ capital — the subsidiaries’ equity positions eliminated against those shares. Positions not selected count as reserves and stay in group equity.
- Dividend income from subsidiaries — where the parent books the dividends it receives from its subsidiaries.
- System accounts — the rows that statycs adds to the group statements. They cannot be deleted, but you can rename them with the pencil or a double-click; clearing the field restores the default name. A new name takes effect at once, in the language you are working in. While consolidation is active, the same rows also appear in the Financial statement design, set apart in a color of their own; they cannot be deleted or moved there either.
- Preview — the structure of the group statements. Activate consolidation saves the setup and switches the group on. While no month has data from every company in the group, the preview shows a placeholder; you can activate anyway, and the group’s figures start with the first month that every company has delivered.
When you first set up the group, every company is ticked, the first company in the Basics table is the parent, the group currency is the parent’s currency, and every holding is 100%. A group needs at least two companies, and the parent’s holding in each subsidiary must be above 0%. The ownership is one percentage per company, applied to every month; changes in ownership over time and indirect holdings are not modeled. A company held through a wholly owned subsidiary is entered as if the parent held it directly. If a partly owned subsidiary itself holds another company of the group, the group’s totals are still correct, but the split of equity and net income between the parent’s owners and the non-controlling interests is not.
A position can be tagged in only one of the lists that could hold it; tagging it in one removes it from the others. After activation, Configure on the same card opens these settings again: the companies, the parent, the ownership, the group currency, the tags and the row names, plus Goodwill and the IC mismatch thresholds. Save applies your changes to all of them except the row names, and Discard changes drops them; row names are saved as soon as you rename them.
Deactivate hides the group but keeps the setup. The card then reads Not set up; the card’s set-up button opens the steps again with your earlier choices filled in, and Activate consolidation brings the group back.
Once the group is active, Consolidation readiness on Data → Company data shows month by month which companies have delivered their data — Ready or Missing, and Not expected before a company’s first month of data — with a Group row that marks the months in which every company that belongs to the group in that month has delivered. Below it, the Intercompany difference line shows for each group month the largest of the three IC elimination differences — P&L, assets and liabilities. It turns red when one of them is above the month’s threshold, which is the largest of the three IC mismatch thresholds: a percentage of group revenue, a percentage of total assets and a minimum amount. For the P&L difference, the percentage of total assets does not count. While one of the group’s latest 12 months is red, admins also get a notification with Review the differences.
Goodwill
A price paid above a subsidiary’s capital lowers the consolidation reserve, so a purchase funded with debt can turn the equity of a healthy group negative. Goodwill entered in the setup corrects that. The amount comes from the accountant’s figures; statycs neither calculates nor suggests one.
Goodwill is in the IC accounts step, below the five lists, and after activation on its own card under Configure. Add goodwill adds a line, usually one per purchase, with three fields:
- From month — the first month the goodwill is on the group’s balance sheet. For a purchase from before the group’s data begins, this is the actual purchase month; the amortization since then is already deducted.
- Amount — in the group currency. It is not translated, so exchange rates do not move it.
- Amortization (years) — up to 50, straight-line from the month after From month; 0 means not amortized.
A field left blank holds nothing back: without an amount there is no goodwill, and without years it is not amortized.
In the group’s statements, the amount shows as Goodwill in Fixed assets, and the Consolidation reserve goes up by the same amount, so total assets and equity rise by it. Amortization shows as Goodwill amortization in Depreciation & amortization. It lowers the goodwill and net income, all of it borne by the parent’s owners, and changes neither EBITDA nor cash. Hidden reserves, deferred taxes and impairments are not modeled.
Exchange rates
Data → FX rates holds the rates the consolidation uses, in ECB notation: units of each currency per 1 EUR (for example 1 EUR = 1.08 USD). Your rates has a row for every currency other than EUR that your companies and the group report in, with the monthly Avg rate for the P&L and the Closing rate for the balance sheet. They are filled in from the European Central Bank’s rates, listed below as ECB reference rates, so normally there is nothing to do.
To use a rate of your own, type over the ECB rate in the same notation or paste several months from Excel, then click Confirm changes. A rate entered by hand replaces the ECB rate for the whole organization. For a currency the ECB does not quote, enter both rates yourself; when a month has no rate, admins get a notification with Enter the rates. If the group currency or the currency of a company in the group has no rate for a month, the group has no figures from that month on.
To apply a spread, click Spread under a currency the ECB quotes and enter a percentage — up to ±25%, negative values too. It is added to every ECB rate of that currency: Avg and Closing, every month, and new months automatically. Rates entered by hand stay as entered. The spread is saved with Confirm changes, and the consolidation uses the rates with it.
Switching to the group
Group is the first entry in the company picker, with the group currency next to it. The section you are on stays open and shows the group. The date picker offers only the group’s months: a month you had picked stays selected if the group has it; otherwise the group’s latest month is selected. When the group is open to you, statycs opens the group’s Dashboard when you sign in or open the organization.
Financials
The P&L, BS and CF tabs show the consolidated statements. Consolidation adds the rows below. Each row is already included in the totals it belongs to and appears only when it has a value. The two rows under thereof: are the exception: they are not added to any total and only split net income.
| Row | Where | What it holds |
|---|---|---|
| Goodwill amortization | in Depreciation & amortization | straight-line amortization of the goodwill entered in the setup |
| IC elimination difference (P&L) | in Other income / loss | what is left when intercompany income and expenses do not cancel out |
| thereof: Owners of the parent and Non-controlling interests | below Net income | how net income splits between the parent’s owners and the minority, when the group does not own every company in full |
| Goodwill | in Fixed assets | the goodwill entered in the setup, less amortization to date |
| IC elimination difference (assets) and IC elimination difference (liabilities) | in Other assets and Other liabilities | intercompany balances that do not cancel out |
| FX translation reserve | in Equity | the difference from translating the companies into the group currency |
| Consolidation reserve | in Equity | the difference between the parent’s investment and the parent’s share of the subsidiaries’ capital, raised by the goodwill entered in the setup |
| Non-controlling interests | in Equity | the minority’s share of the subsidiaries’ equity |
| Consolidation balancing reserve | in Equity | what keeps the group balance sheet in balance — normally 0; an amount here points to an error in the data or the setup |
| FX effect | between Cash flow from financing and ∆ Cash | the change in cash that comes only from translating foreign-currency cash at new rates |
| Scope changes | between Cash flow from financing and ∆ Cash | the cash a company brings into the group when it joins |
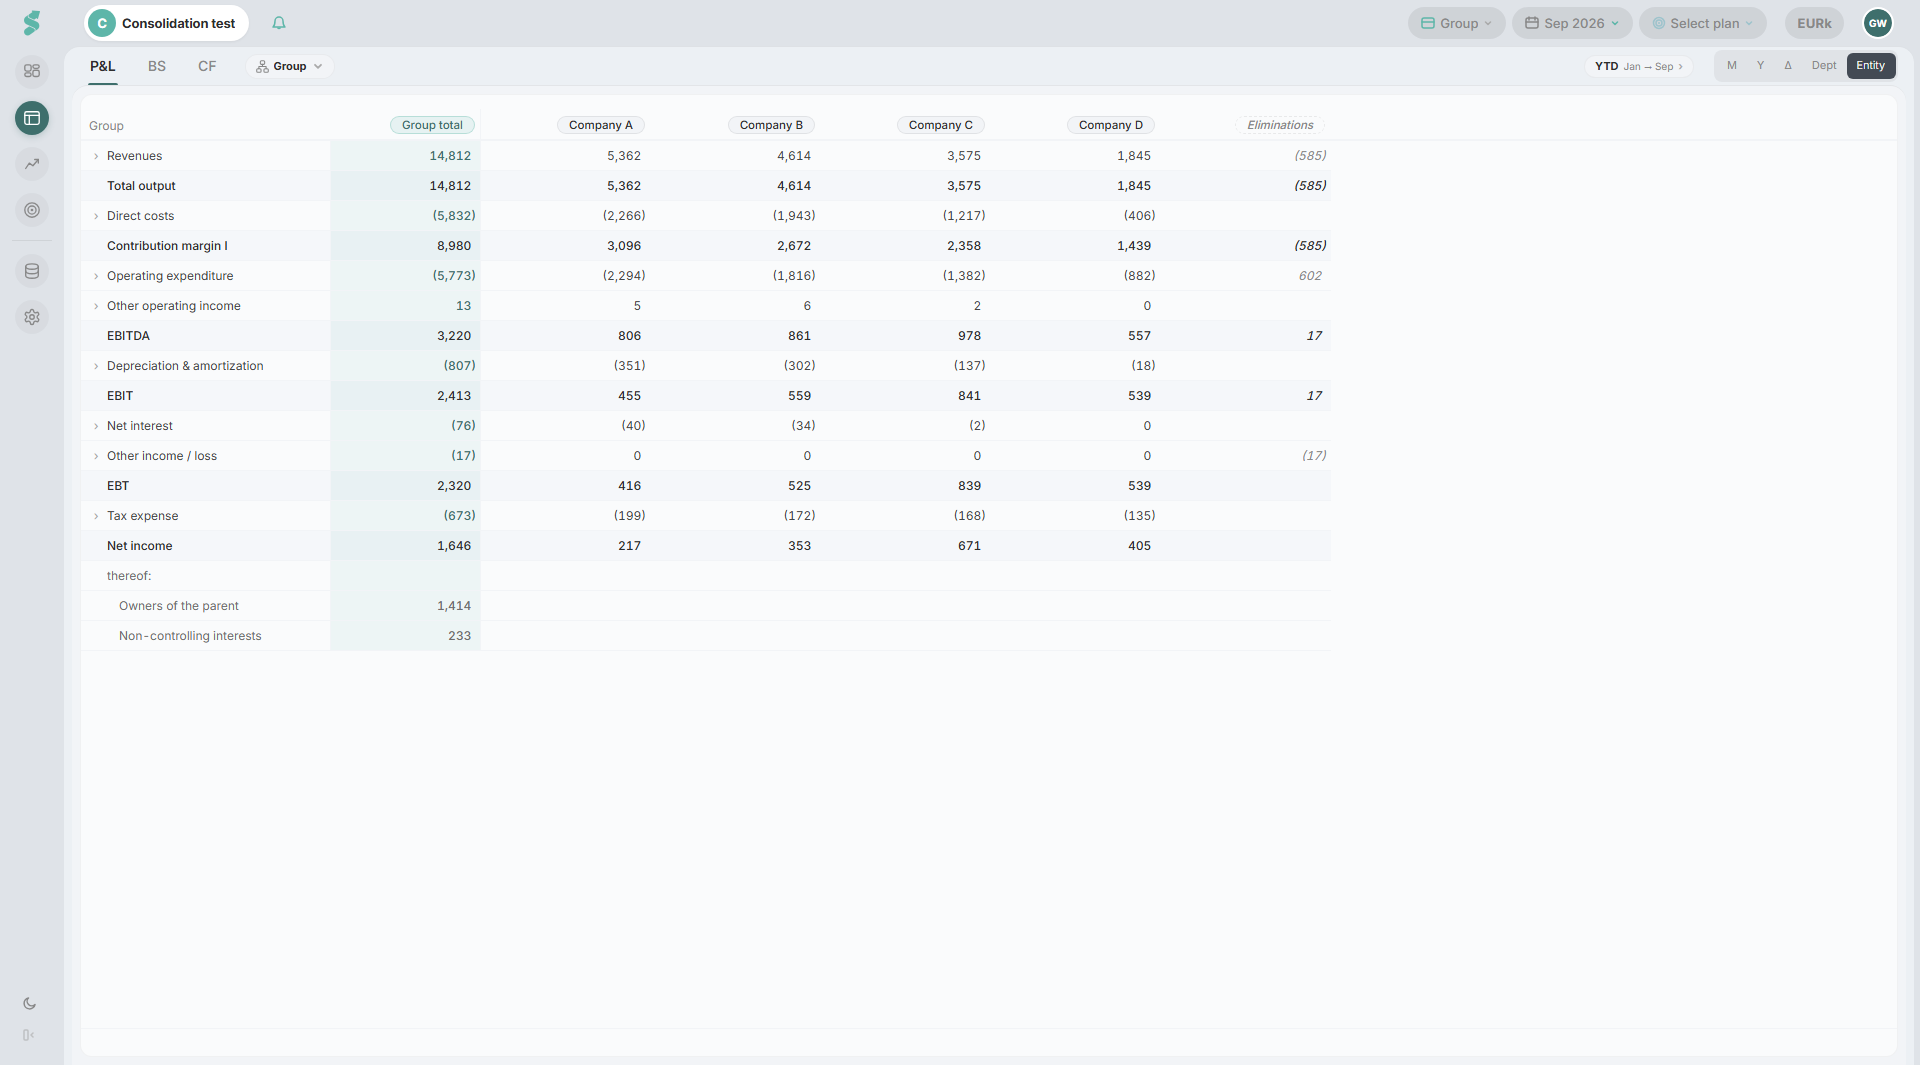
Entity, next to M, Y and Δ, shows a statement with one column per company for the selected period instead of one column per month: Group total first, then each company translated into the group currency, then Eliminations — what the consolidation removed. A company outside the group has no column.
In M, Y and Δ, the Show levels option Entities adds one row per company under each Level 2 position other than the consolidation rows, with that company’s figure before eliminations.
In the Δ view of a group in which at least one company reports in a currency other than the group currency, Isolate FX effect splits the variance against the prior year or against a group plan into two parts: Δ constant FX, the change at last year’s exchange rates or at the plan’s rates, and Δ FX, what the rate movement did.
In Show levels, Account groups and Accounts work for the group too; the accounts are each company’s own, named with the company. Under every Level 2 position that the consolidation changed, Intercompany eliminations follows the accounts with what was removed, so the accounts and that row add up to the position. The accounts are not shown in Entity, with Entities on, or for a single department.
With the Departments add-on on, the group’s P&L can also be read by department: the scope pill shows one department across the whole group, Dept shows one column per department, and in Show levels, Departments adds each company’s departments under Entities. Other holds what no department carries, including every company without departments. The scope pill’s top entry — all departments together — and the total column in Dept read Group.
Analysis
For the group, Overview, Explorer, KPIs, Variance, Accounts, Comparison and Views show the consolidated figures. Projects and Entries are not available for the group.
- KPIs holds the group’s own KPIs, calculated from the consolidated figures; admins set them up as they do for a company. In a KPI formula, a statement line can be limited to one company of the group — its figures before eliminations — or to one department, with Group and Department above the list of lines; see Formula syntax.
- Variance compares the group with the prior year or with the plan selected in the top bar; Comparison offers the group’s actuals of this fiscal year and the year before, and the group plans set to Active.
- Accounts lists each company’s accounts under the group’s positions, with the company in a column of its own, and Intercompany eliminations under every Level 2 position that the consolidation changed.
- Overview works as for a company: admins can add boards and custom charts for the group.
- Views holds the group’s own views, created and changed by admins. A position in a group view can show the group, one Company — its figures translated into the group currency, before eliminations — or one Department of a company that reports in the group currency. Use as KPI works for every row of a group view; a row that shows one company or one department carries that company or department over into the KPI.
Dashboard
The group dashboard has the tabs Overview — the overview every company has, with the group’s figures — and Group, plus any custom boards an admin adds.
Group shows how the group is made up:
- three cards with key figures against the prior year or the selected plan, as chosen in the subheader, and Consolidated through with the group’s latest month and the number of companies in the group;
- Companies in the group — each company’s figures in the group currency and its Actuals up to month, then the Eliminations and the Group total; below it, Not included in the consolidation lists the companies outside the group, each in its own currency;
- three charts: two that stack a figure by company, and one that shows a figure of the group as a line; each adds the same figure of the prior year or of the plan as a dashed line.
In edit mode, admins choose the figures on the cards, in the charts and in the table columns; Reset to default brings the tab back to its default for everyone in the organization. On Group these figures are statement positions; on Overview, the KPI cards and the KPI sidebar can also show the group’s KPIs, and so can the metric and KPI widgets on custom boards.
Group plans
For the group, Planning holds group plans. A group plan combines one plan per company. To create the first one, click Create group plan; after that, use Add plan — in the group, every new plan is a group plan. On a company’s Planning page, tick Group plan in the new-plan dialog. Then, under Entity plans, choose each company’s plan: Create a new plan, Copy a plan or Add an existing plan.
A group plan can also be created from one Excel file: click Import from Excel and choose the upload mode By group or By group & department — see Plan Import / Export. The import creates the group plan with a new plan for every company in the group and fills each company’s plan from that company’s tabs.
Each company’s plan is an ordinary plan of that company: it is edited and set active on the company’s own Planning page. The group plan’s Overview lists each company’s plan and its status. The group plan can be set to Active only when every company’s plan is active; if a company’s plan goes back to Draft, the group plan reads Draft again. In a formula of a company’s plan, statement lines of the other companies in the same group plan can be used: the formula picker’s company tab lists them, and the value is that company’s plan in this company’s currency at the group plan’s rates — see Formula syntax.
For a group with a company in another currency, Exchange rates fixes one rate per currency, quoted per 1 unit of the group currency and proposed from the closing rate of the last actual month. Until an admin sets the group plan to Active, an admin can change the rates with Update rates. Once it is set to Active, the rates are frozen until an admin sets it back to Draft — even while the group plan shows Draft because a company’s plan went back to Draft.
The group plan’s P&L, BS and CF tabs show the consolidated plan, read-only and month by month: the last three actual months, then the plan months. The figures show as soon as the companies’ plans have them, also while the group plan is Draft. In Show levels, Entities adds each company’s figure under the Level 2 positions; for a group plan by departments, the scope pill shows the P&L of one department. A group plan has no Scenarios tab.
Only group plans set to Active are offered in the plan picker in the top bar, listed first. Picked there, a group plan works like a company’s plan: Financials shows its months after the actuals and compares with it in the Δ view, and Dashboard and Analysis, KPIs included, compare the group with it.
Not available for the group yet
- Departments in Analysis: Accounts and Comparison show the whole group. A group view can still show one company’s department.
Related
- Financials — the statements and their views
- Analysis — tab bar and shared controls
- Views — building a report row by row
- Dashboard — the overview and its cards
- Planning — company plans
- Data Management — the Data section