Views
What Views is for
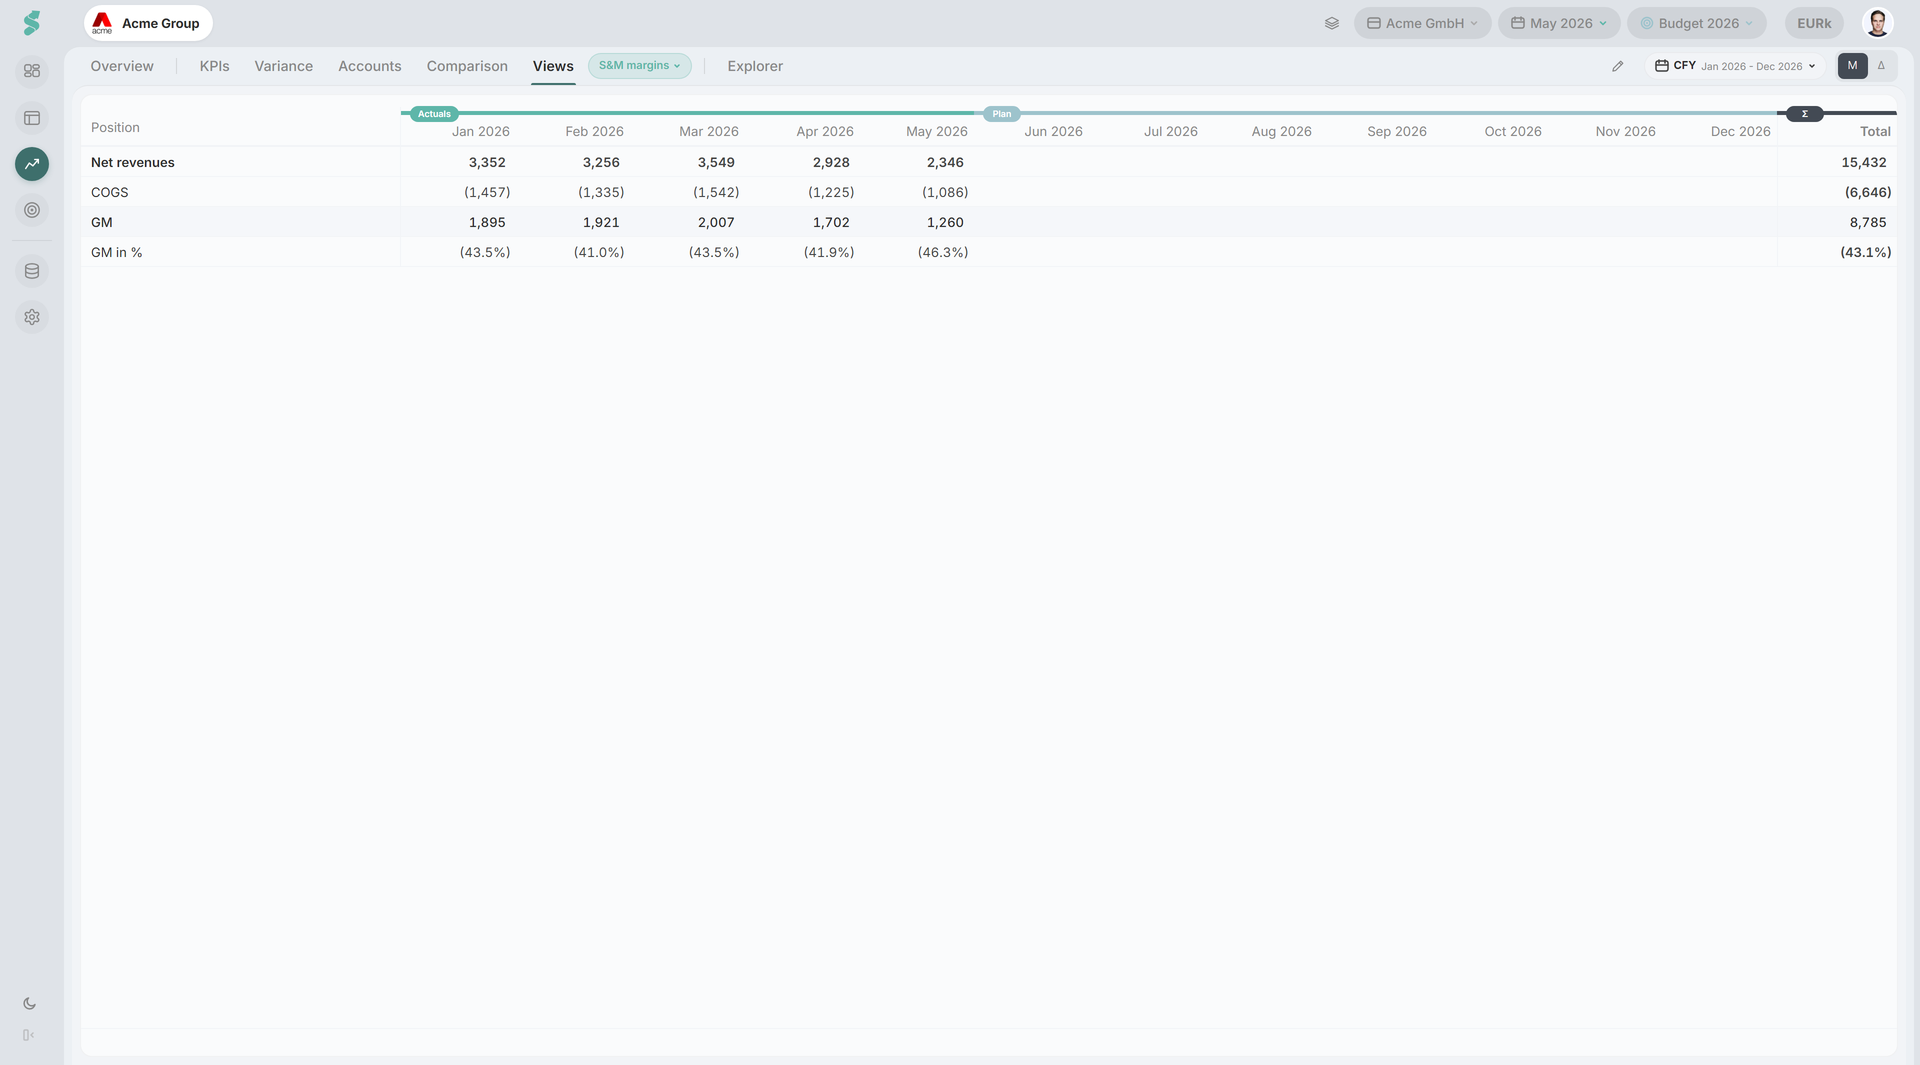
A view is a report you build line by line. Every row is a selector over the account mapping you already have, so a view adds no second chart of accounts and no second mapping — it is a different way of printing the same figures.
Use it for the management report your company actually reads, in the order it reads it, rather than the statement layout the template ships.
TL;DR
Add a row, point it at positions or write a formula, and the view is shared with everyone on the company. Which view you have open is yours alone.
How Views works
A company with no saved view sees one seeded from its own live statement — the operating block at level 2, closed by an = EBITDA row. That seed is a demonstration, not a default: it is never written until you change something.
Nothing totals automatically. A total is a row you add, which is why a view can print a subtotal anywhere you want one.
Views elements
The view picker
Many views live behind the one tab, selected by a pill beside it. Manage views creates, renames and deletes. A deleted view is gone for everyone on the company.
Layouts
- M — months across, one column per month in the window, scrolling sideways.
- Δ — Actuals, Plan, PY and the share columns side by side.
They compete for the same width, so they are alternatives rather than one grid.
Rows
The ✎ on a row opens the row editor. There is no Save button — every change applies as you make it, and the table behind the modal updates live.
- Built from — Positions sums what it lists: statement nodes, GL accounts, and other rows of the view, which is how a subtotal is built. Formula evaluates an expression.
- Shown as — Currency, Percent or Number.
- Emphasis — Normal, Bold or Total row.
- Use as the ”% of” basis — mark one row as the denominator and every other row shows as a share of it, in the Δ layout. There is exactly one basis per view.
- Use as KPI — promotes the row to a custom KPI so it can be used on dashboards, in charts and inside other formulas.
Drag a row to reorder it; a drop line shows where it will land.
Formulas
The formula editor is the planning one with its metric-defining half removed: + − × ÷ ( ), numbers and references, no functions, powers or time windows. Σ folds every referenceable row above this one into the expression in one click — rows below are deliberately excluded so a mid-table total cannot swallow the lines printed under it.
Departments
Department scope rides on the position, not on the view, so one view can mix a company figure and a departmental one. As in planning, cross-department references are P&L only.
Warnings on a row
- circular reference — these rows reference each other in a loop, so there is no value to compute.
- double counted — the row’s positions overlap, so something is counted twice.
Export
The view exports to Excel in the layout you are looking at.
Related
- Analysis — tab bar and shared controls
- Financials — the statement layout a view departs from
- KPIs — where a promoted row shows up
- Planning — the formula editor this one borrows