Projects
What Projects is for
Projects reads your ledger along the project dimension — the cost object — the way Departments reads it along the organizational one. It answers “which project should I be looking at”, then lets you open that project and see the statement behind it.
Every distinct project code in the ledger becomes a project on import, so the section is populated the moment journal entries land. It needs that line-level data: a company that uploads aggregated figures has nothing to group by, and the tab stays hidden.
TL;DR
Projects ranked by risk, each with a spend budget and a project-to-date contribution statement. Figures run from the project’s first posting, never a fiscal window.
How Projects works
Every figure is project-to-date. A project crosses fiscal years, so a window would make “remaining” meaningless and the tab deliberately takes no range.
The sum of your projects is not the company. Overhead, administration and financing are booked to no project — so the overview carries no company total, and the statement’s subtotal is called Project contribution, never EBITDA. A department’s EBITDA sums to the company’s; a project’s never will.
Projects elements
Overview
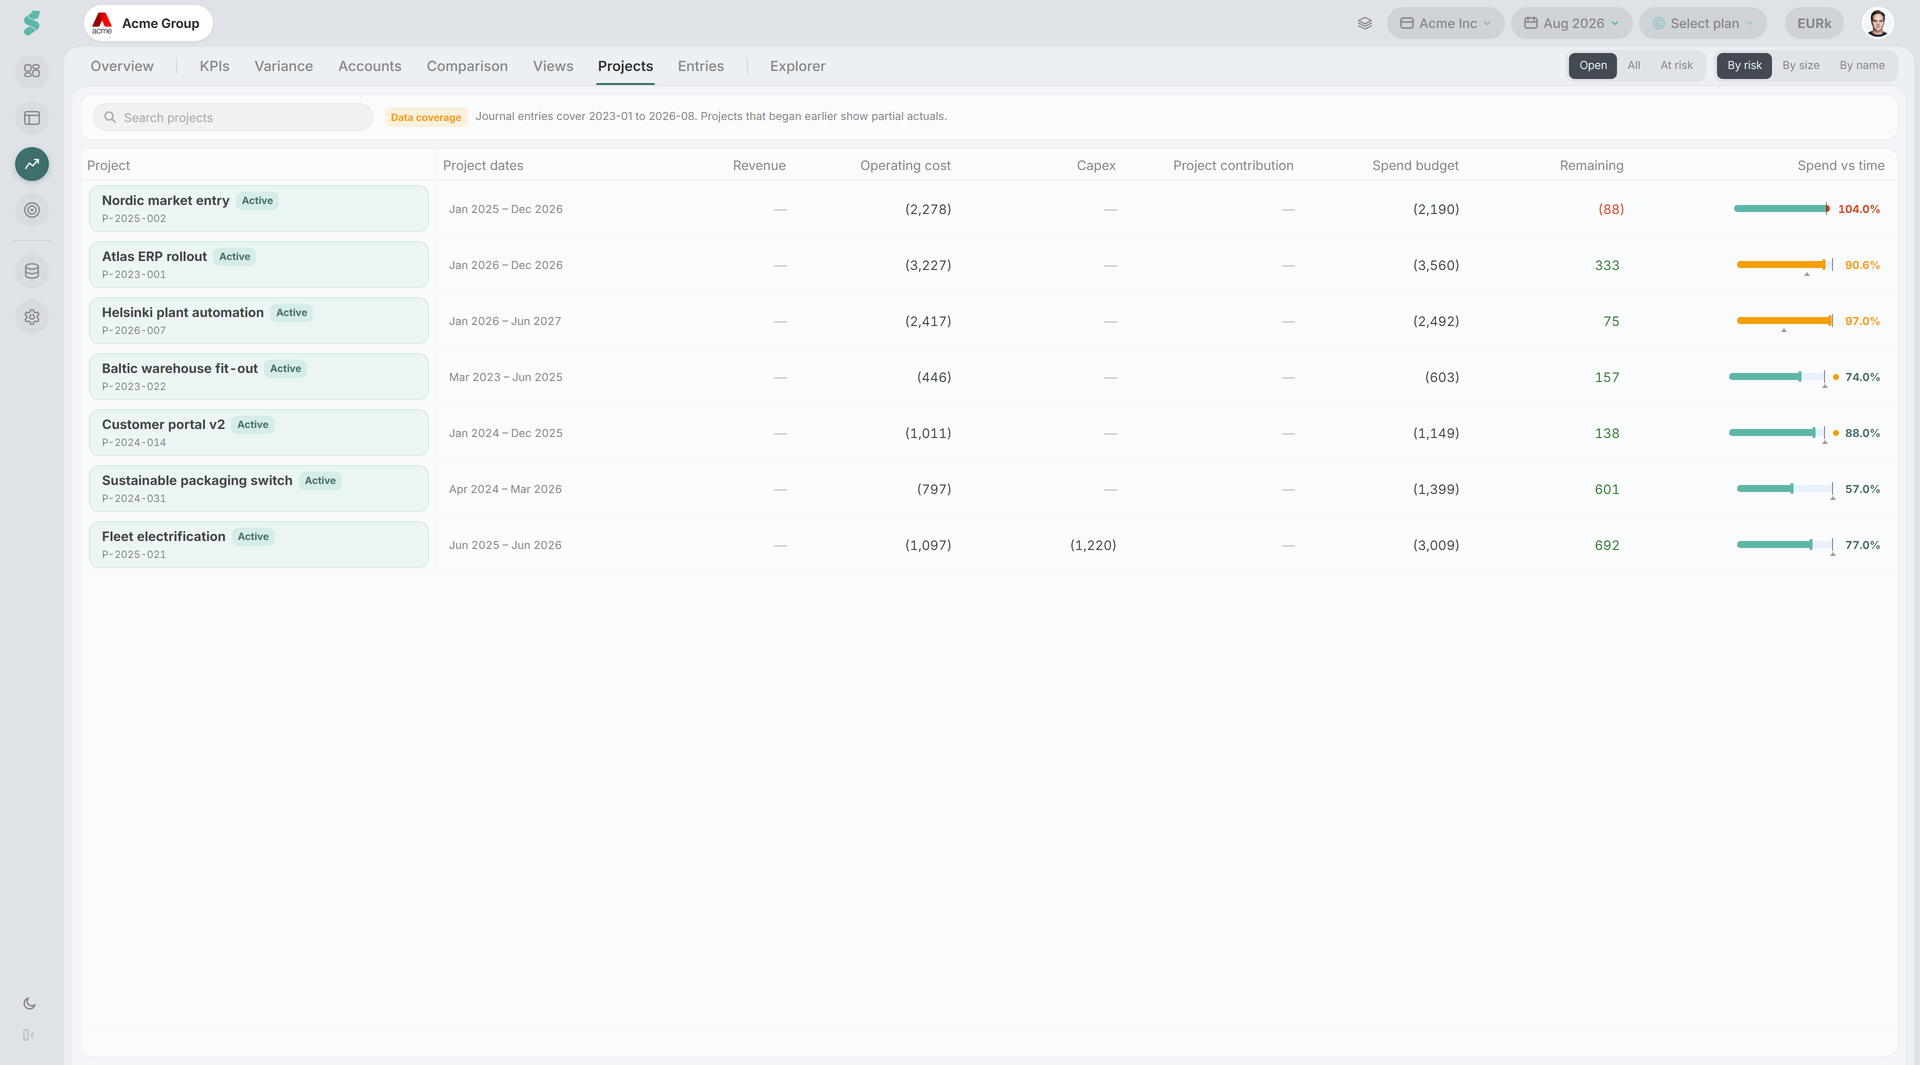
One row per project: Project, Project dates, Revenue, Operating cost, Capex, Project contribution, Spend budget, Budget used and Spend vs time.
- Filter — Open, All, or At risk.
- Sort — By risk, By size, or By name.
- Search by name or code.
Spend vs time compares budget consumed against schedule elapsed: Spend on track, Watch, Over budget, or No budget / No dates when there is nothing to compare. Direction decides the color, not sign — overshooting a cost budget and missing a revenue target are both unfavorable and point opposite ways.
Project detail
Opening a project gives the statement: the P&L down to Project contribution, then Capex. Columns are Position, Actuals to date, Spend budget, Remaining and Budget used. Remaining is actuals against budget.
- Show levels — Level 1, Level 2, Account groups, Accounts, Capex. Two independent masks, so you can drill the cost side without unfolding revenue.
- Hide empty rows — empty means no budget and no actual. A budgeted position with nothing spent still shows, at 0% used.
Budgets
Budgets are typed at level 2, the same tier the planning grid writes at, so a number means the same thing in both places. Sums roll up; they cannot roll down, which is why there is no tier to choose — and the capex lines are that block’s level 2, not an exception. Each cell commits on its own as you leave it. Editing budgets needs edit rights on the company.
If Show levels hides the tier a project budgets at, its figures still roll up but cannot be edited until you show that level again.
Master data
A project carries a name, a status — Active, On hold, Completed — and start and end dates. Dates are what the schedule signal is measured against; without them a project shows No dates. A project whose end date has passed is offered as completed.
Data coverage
The tab reports the window your journal entries cover. A project that began before that window opens shows incomplete actuals and an overstated remaining budget, and says so on the row.
Blank is never zero: an amount that is missing or unreadable is dropped rather than counted as nothing.
Export
The overview and the project statement both export to Excel.
Related
- Analysis — tab bar and shared controls
- Journal entries — the postings this layer groups
- Departments — the same idea along the organizational dimension
- Planning — the level-2 tier budgets are typed at