Comparison
What Comparison is for
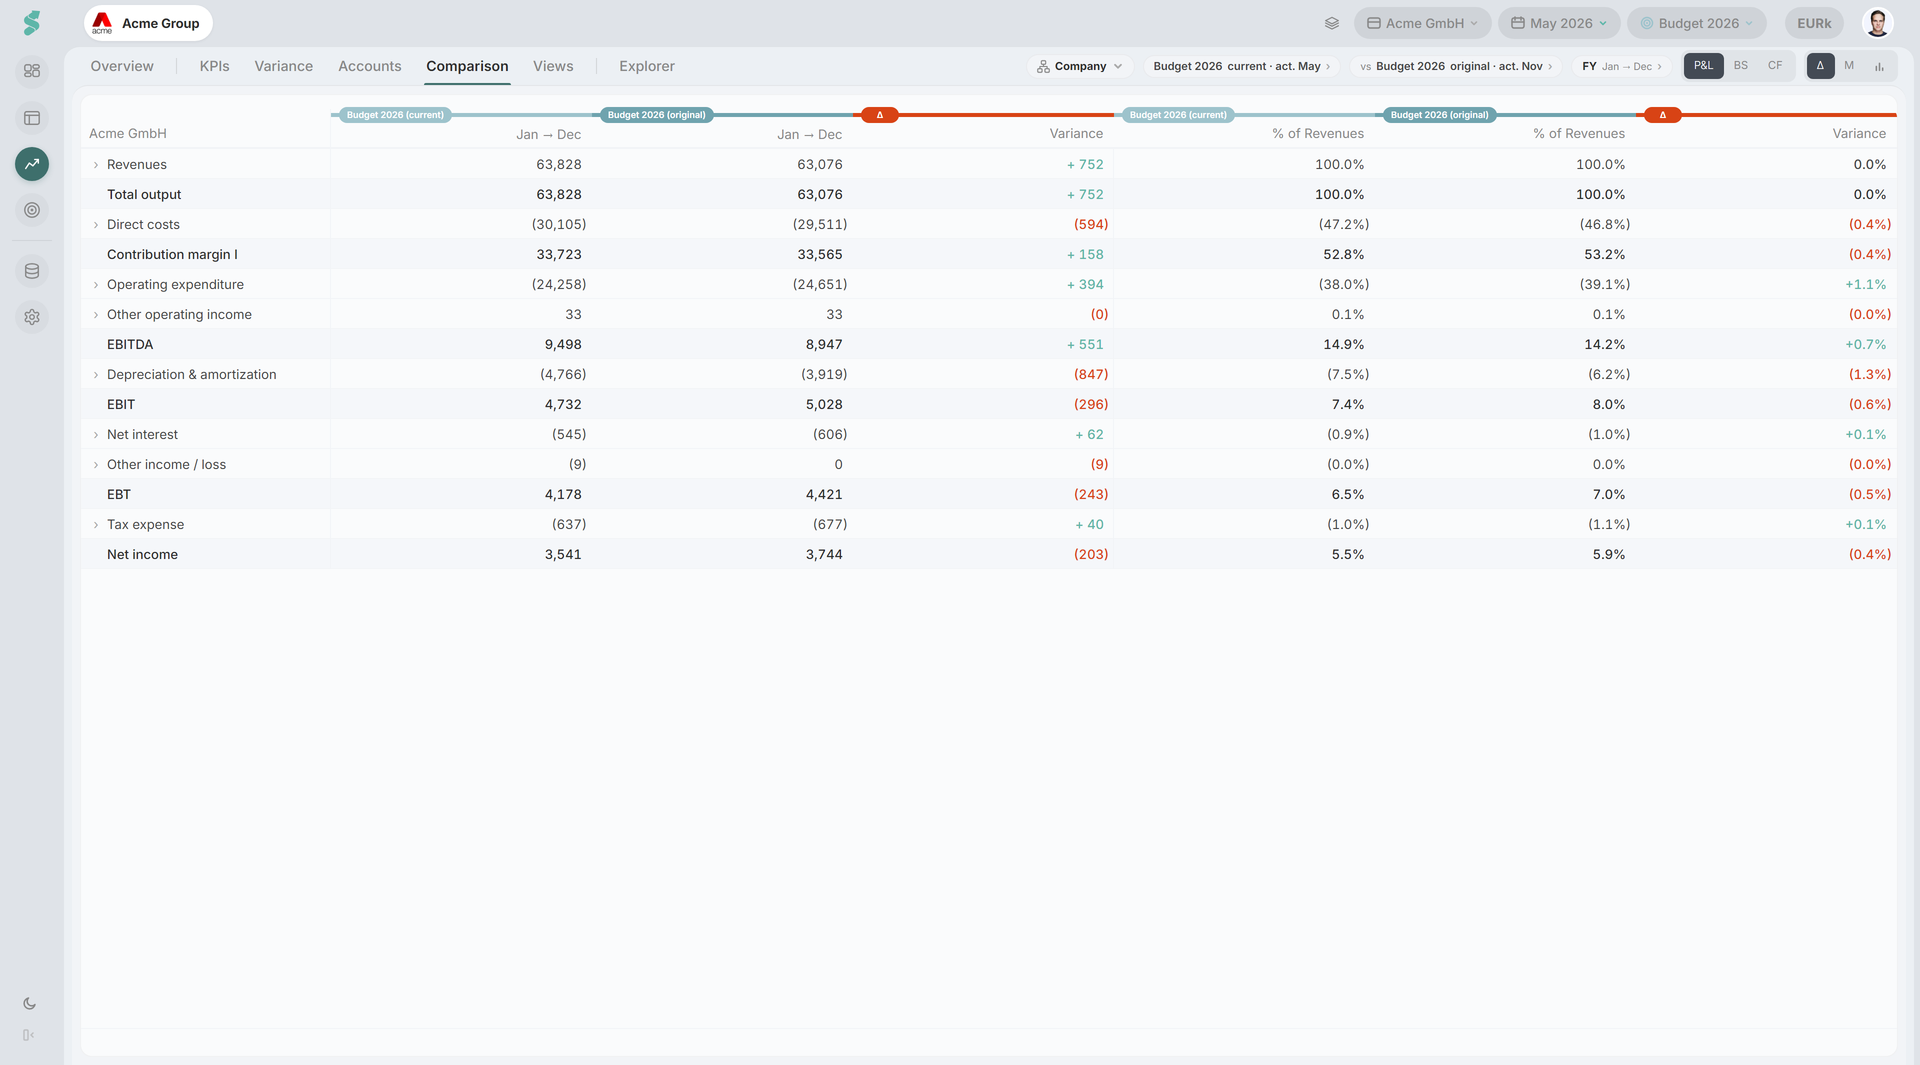
The Comparison tab puts any two sides of your figures next to each other and shows the difference. Two plans against one another, a plan against actuals, this year against last — all of it is two picks from one source list, so there is no separate “vs prior year” mode to learn.
Use it to see what changed between the budget you wrote in autumn and the one you re-cut in spring, or how the year is tracking against either.
TL;DR
Pick a source for side A and side B, pick a window, and read the difference. Three views: Comparison, Monthly deviation, Charts.
How Comparison works
Both sides read the same number of months, so the two columns are always comparable. An actuals source keeps its own year — which is how prior year falls out without a dedicated control. A plan is read at the year under examination, because a plan is not owned by one fiscal year: “Budget 2026” on real data can span 2025-12 to 2027-12.
Each plan side is read as a rolling forecast at its own Last actual boundary, so both sides are a genuine re-blend rather than the same stored December twice.
Comparison elements
The control row
Everything sits in the Analysis subheader beside the tab strip: the statement tabs (P&L / BS / CF), the department scope, both source pickers, the shared window, and the view switch.
Sources
Each side picks from the actuals years your data covers and every plan on the company. No source leaves a side empty. Beside each plan sits the Last actual switch:
- Original — as the plan was written.
- Current — with actuals to date blended in.
The pill under each side reads back what it resolved to, for example Current · act. Jun 2026.
Window
FY, H1, H2, Q1–Q4. The window is a span of months, applied to whichever year each side reports — that is what lets one range pill serve both sides.
Views
- Comparison — the A | B | Δ grid, the same surface Financials uses.
- Monthly deviation — one column per month holding
A − B. The band header names the subtraction, not a source. - Charts — revenues, EBITDA and cash, side by side. These three sit on three different statements, so the statement tabs are hidden here rather than dimmed. A variance bridge sits beneath them.
Department scope
Department scope applies to the P&L only. On the balance sheet and cash flow the pill dims: the selection still means something, it just does not apply. A company-level plan has no departmental figures, and the side says so rather than showing zeros.
Status notes
A side tells you when it cannot answer: outside your data access, no figures for the period, or showing the plan as written because the rolling forecast is only available for the plan selected in the top bar.
Related
- Analysis — tab bar and shared controls
- Variance — the same bridge, from Plan or PY to one target KPI
- Financials — the delta surface this tab reuses
- Planning — where the plans being compared are built